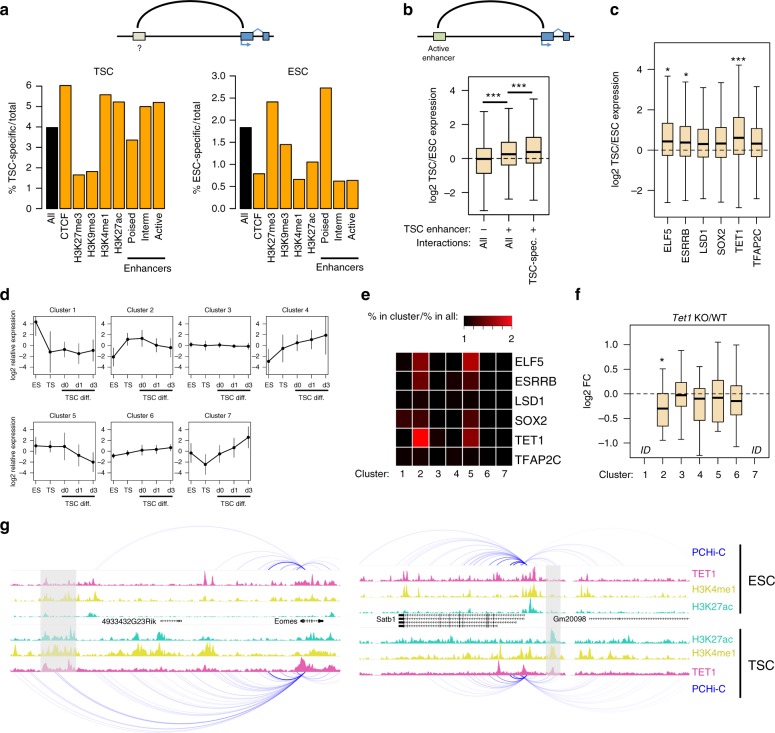
Fig. 4.
TSC-specific interactions involve TET1-regulated genes. a Percentage of cell-specific interactions among all interactions (black bars) or promoter–genome interactions with the indicated proteins/modifications/features (orange bars). b Expression ratio (log2) between TSCs and ESCs for genes involved in interactions (all or ESC-specific) with active enhancers, and compared with genes that do not interact with any active enhancer. ***p < 0.0005 (t-test, corrected for multiple comparisons). c Expression ratio (log2) between TSCs and ESCs for genes involved in interactions with active enhancers bound by the indicated transcription factors in TSCs. *p < 0.005, ***p < 0.00005, compared to LSD1 (ANOVA with Tukey post hoc test). d Relative expression profiles of genes grouped by k-means clustering based on expression in ESCs, TSCs and differentiating TSCs (days of differentiation are indicated). Error bars represent standard deviations. e Heatmap displaying the enrichment of genes interacting with enhancers bound by the indicated transcription factors in each cluster (relative to the abundance across all clusters). f Expression ratio (log2) between Tet1 KO and WT TSCs for genes interacting with enhancers bound by TET1 in each cluster. ID indicates insufficient data. *p < 0.01, compared to all genes (ANOVA with Tukey post hoc test). g Examples of TET1-regulated genes displaying interactions with TET1-bound enhancers in TSCs. Grey boxes highlight TET1-bound enhancers in TSCs. Boxplot midline represents median, box edges the first and third quartiles, and whisker edges are the last data points within 1.5× the interquartile range

