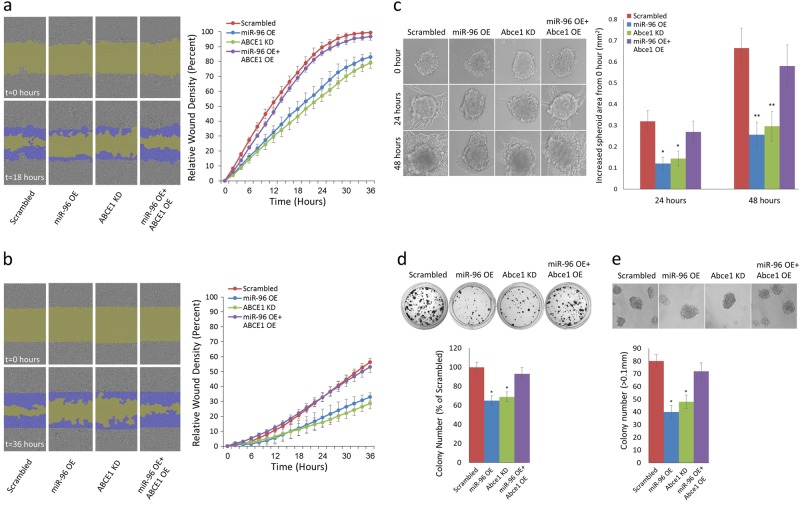
Fig. 3. miR-96 OE and ABCE1 KD downregulates 2D and 3D migration, invasion, and proliferation of breast cancer cells.
a Representative images of a migration assay (left) and mean scratch area closure over time (right). The upper row represents time 0 and the bottom row represents 18 h post-scratch. HS578 cells (scrambled/miR-96 OE/ABCE1 KD/miR-96 OE + ABCE1 OE) are shown in gray, the green area represents the scratch, and migrating cells are indicated in dark blue. The migration assay mean scratch area closure over time reveals a delay in the rate of migration of cells that overexpress miR-96 or underexpress ABCE1 compared to the scrambled control. Overexpression of ABCE1 in miR-96 OE cells abrogates miR-96 migration inhibition. Error bars were calculated for each measurement. b Representative images of an invasion assay (left) and mean scratch area closure over time (right). The upper image represents time 0 and the bottom image represents 36 h post-scratch. Invading HS578 cells (scrambled/miR-96 OE/ABCE1 KD/miR-96 OE + ABCE1 OE) are indicated in dark blue. The invasion assay mean scratch area closure over time demonstrates slower invasion rates for miR-96 OE and ABCE1 KD cells. Overexpression of ABCE1 in miR-96 OE cells reversed miR-96 inhibitory effect on invasion. Error bars were calculated for each measurement. c Representative images from 4T1 spheroid invasion assays on the day of seeding (0 h), 24 h, and 48 h after seeding (left) and quantification of results (right). A significant decrease of spheroid invasion was noted for miR-96 OE and Abce1 KD cells. Spheroids co-overexpressing miR-96 and Abce1 invaded similarly to scrambled control spheroids. d Representative images (top) and quantification (bottom) from colony formation assays. e Representative images (top) and quantification (bottom) of colony numbers from anchorage-independent growth assay. Only colonies larger than 0.1 mm in diameter were counted. Data are presented as mean +/− SEM. *p < 0.05, **p < 0.01

