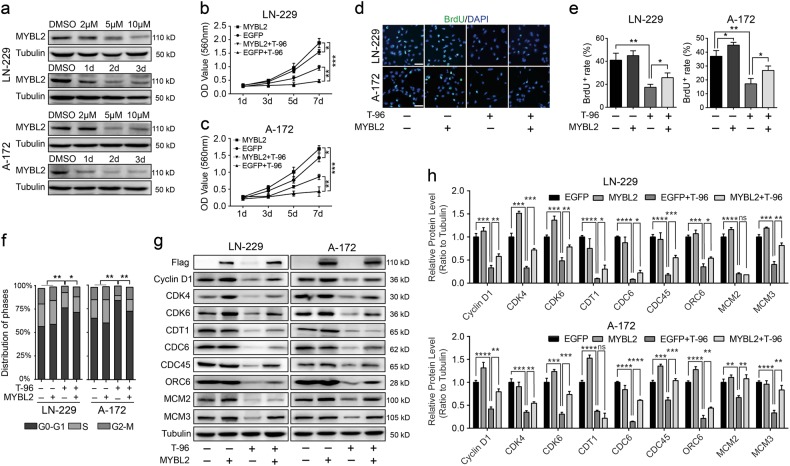
Fig. 5. MYBL2 is required for T-96-induced cell growth and proliferation inhibition.
a MYBL2 expression was analysed via Western blot assays after cells were treated with T-96. Cells were treated with the indicated concentration of T-96 for the indicated times. In the concentration gradient group, cells were treated with different concentrations of T-96 (2, 5 and 10 μM) for two days, and DMSO was used as the control; in the time gradient group, cells were treated with 10 μM T-96 for different times (1, 2 and 3 days), and DMSO was used as the control. b, c The effect of DMSO or T-96 on the viability of MYBL2/EGFP-overexpressing LN-229 and A-172 cells. d Representative image of BrdU staining of MYBL2-overexpressing or EGFP-overexpressing LN-229 and A-172 cells after treatment with DMSO or 10 μM T-96 for 2 days; scale bar = 100 μm. e Quantification of BrdU-positive staining rates in MYBL2-overexpressing or EGFP-overexpressing LN-229 and A-172 cells after treatment with DMSO or 10 μM T-96 for 2 days. f Cell cycle distribution was analysed in MYBL2-overexpressing or EGFP-overexpressing LN-229 and A-172 cells after treatment with DMSO or T-96 for 2 days. g Western blot assays were performed to evaluate proteins related to the cell cycle and DNA replication in MYBL2-overexpressing or EGFP-overexpressing LN-229 or A-172 cells after treatment with DMSO or T-96 for 2 days. Tubulin was used as the control. h Densitometry of Western blot in the panel g. All data were analysed using unpaired Student’s t-tests and are shown as the means ± SD. *p < 0.05, **p < 0.01, ***p < 0.001, ****p < 0.0001; ns no significant difference

