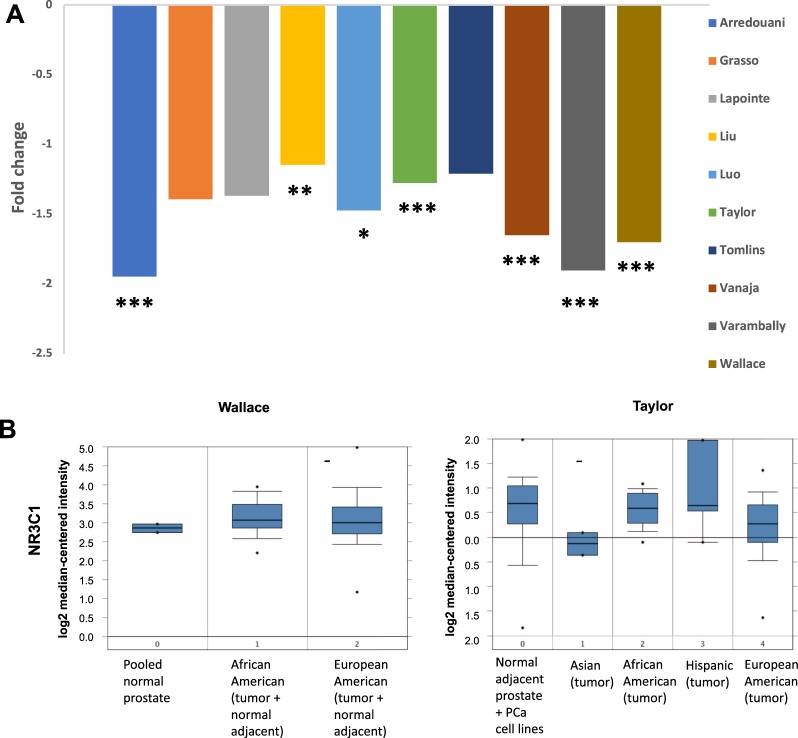
Figure 8.
Expression of GR/NR3C1 transcript between clinical prostate cancer tissues specimens from African Americans and European Americans in Oncomine. Transcript expression levels of GR/NR3C1 in prostate tumors versus normal prostate tissues was derived from cancer gene microarray datasets in Oncomine database. Individual dataset names appear in the legend boxes at the right (A). Box-plots from the Wallace and Taylor datasets were used from Oncomine gene microarray database (B). Fold-changes and corresponding P-values for the differences in gene expression between PCa and normal prostate tissues were obtained from Oncomine. The number of samples in each dataset is different, therefore higher fold change does not always correspond to statistical significance. *P < 0.05, **P < 0.01, ***P < 0.001.

