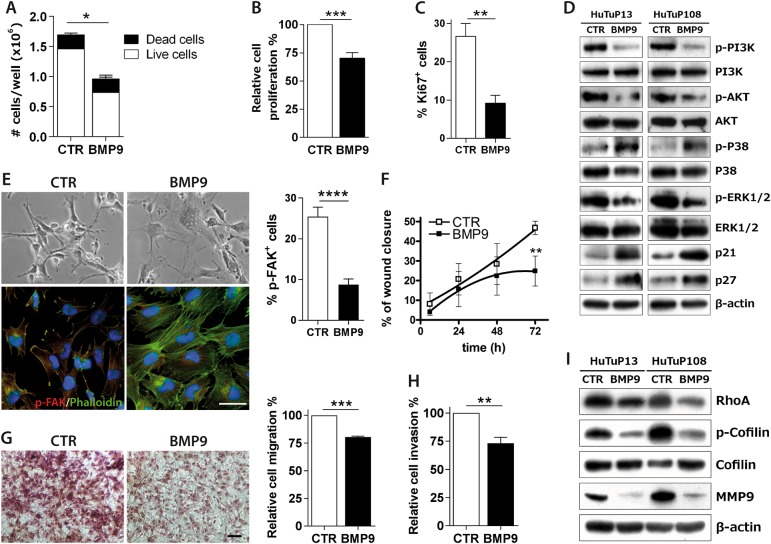
Fig. 2.
BMP9 effects on GBM invasiveness in vitro. Trypan blue count after BMP9 treatment at 30 ng/ml every other day for 10 days (HuTuP82/83/187) (a). Cell proliferation evaluated by MTT assay, after further 72 h of BMP9 treatment at 30 ng/ml added to previous 10 day exposure (HuTuP82/83) (b). Quantification of the percentage of Ki67+ cells treated with BMP9 30 ng/ml every other day for 10 days (HuTuP83/108) (c). Immunoblotting of indicated proteins following 24 h of BMP9 treatment at 30 ng/ml (HuTuP13/108) (d). Representative images of HuTuP13 cells treated with BMP9 30 ng/ml every other day for 10 days, captured by optical microscope (original magnification 10×, scale bar = 100μm, upper panel) and marked with phalloidin-FITC (green) and p-FAK antibody (red). Cell nuclei have been counterstained with DAPI (blue) (original magnification 20×, scale bar = 50μm, lower panel). Relative quantification of p-FAK+ cells (right graph) (e). Quantification of wound closure of control or BMP9-treated 30 ng/ml during time (HuTuP10/83). Statistical significance by paired t-test at 72 h (f). Transwell migration assay of GBM primary cells (HuTuP83/13/82/175) treated with BMP9 30 ng/mL for 24 h, and stained with Crystal violet. Representative images (original magnification 10×, scale bar = 100 μm, left) and relative quantification of the absorbance at 560 nm of solubilized Crystal Violet (right) (g). Percentage of cell invasion (HuTuP10/13) measured by the Cultrex transwell assay, after 48 h of treatment (h). Immunoblotting of indicated proteins following 10 days of BMP9 treatment at 30 ng/ml (HuTuP13/108) (i). Data are presented as mean ± S.E.M. of N ≥ 3 independent experiments. *p < 0.05; **p < 0.01; ***p < 0.001; ****p < 0.0001 by t-test

