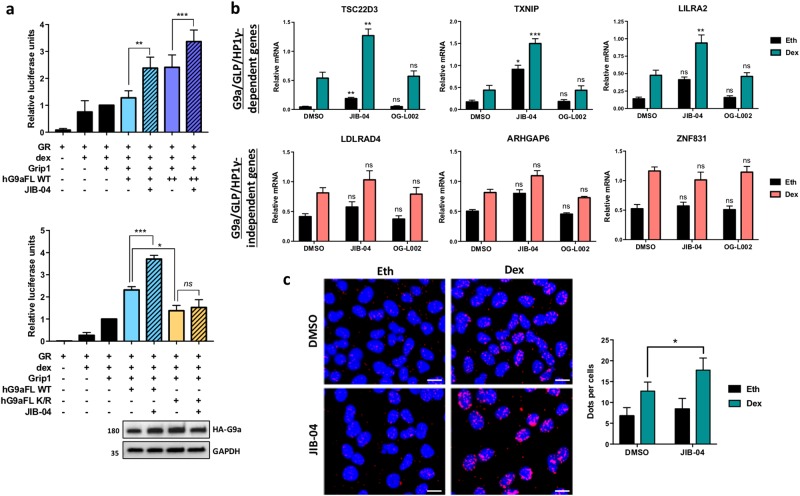
Fig. 4. JIB-04 enhances G9a-regulated transcription.
a CV-1 cells were transfected with MMTV-LUC reporter plasmid (200 ng) and plasmids encoding GR (1 ng), Grip1 (100 ng) and HA-labeled full-length (FL) hG9a wild type at 100 ng (+) or 250 ng (++) (upper panel) and HA-labeled full-length hG9a wild type or K185R mutant (250 ng) (lower panel). Cells were grown with 100 nM dex or the equivalent amount of ethanol, along with 0.5 μM JIB-04 or equivalent volume of DMSO for 24 h and assayed for luciferase activity. Relative luciferase units are normalized to sample 3 and represent mean ± SEM for five independent experiments, each with three biological replicates. The p value was calculated using a paired t-test: *p ≤ 0.05, **p ≤ 0.01, ***p ≤ 0.001, ns not significant. Whole-cell extracts were analyzed for G9a expression by immunoblot with indicated antibodies (lower panel). b Nalm6 cells were treated for 16 h with either JIB-04 at 0.5 μM, OG-L002 at 10 μM or DMSO. Then, cells were treated with 100 nM dex or ethanol for 8 h in addition to the previous drugs. mRNA levels for dex-regulated genes validated in Fig. 2b were measured by reverse transcriptase followed by qPCR and normalized to β-actin mRNA levels. Results shown are mean ± SEM for six independent experiments. The p value was calculated using a paired t-test between DMSO versus JIB-04 or OG-L002 samples: *p ≤ 0.05, **p ≤ 0.01, ***p ≤ 0.001, ns not significant. c To analyze interaction of endogenous GR and HP1γ by PLA, A549 cells were treated with 0.5 μM JIB-04 or the equivalent volume of vehicle DMSO for 24 h, then with the addition of 100 nM dex or the equivalent volume of vehicle ethanol (Eth) for 2 h. After cell fixation, PLA was performed with antibodies against GR and HP1γ. The detected interactions are indicated by red dots. The nuclei were counterstained with 4′,6-diamidino-2-phenylindole (DAPI; blue). The number of interactions detected by ImageJ analysis is shown as the mean ± SEM of three independent experiments. The p value was determined using a paired t-test: *p ≤ 0.05. Scale bar represents 10 μm

