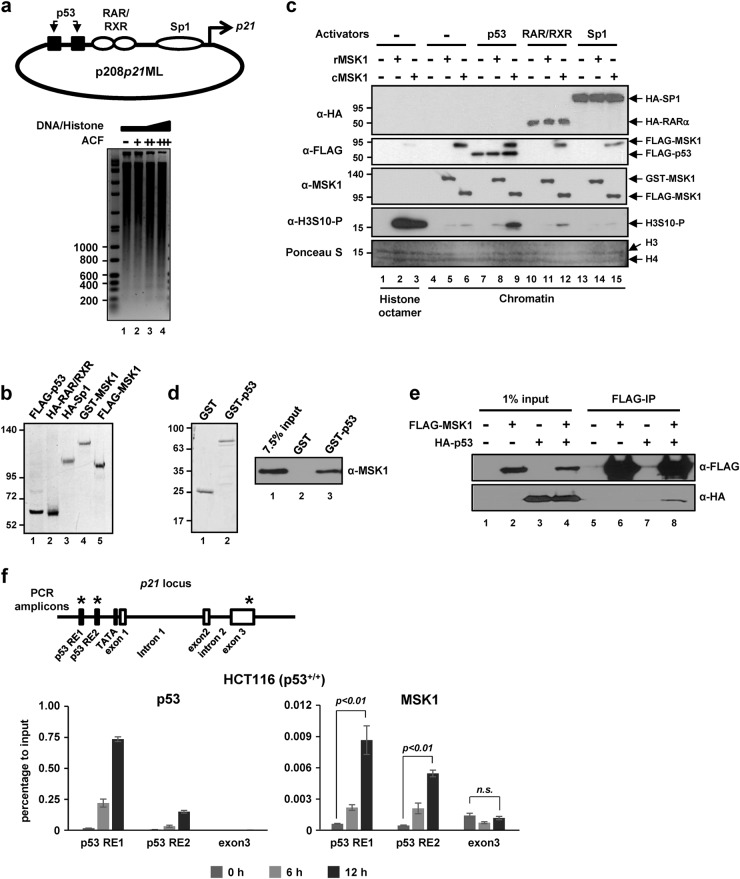
Fig. 1. p53-dependent chromatin phosphorylation by MSK1 in vitro.
a The binding sites of three transcription factors and the transcription start site are indicated in the 2.4 kb of the p21 promoter region (top panel). Recombinant chromatin was assembled with a p21 promoter-containing plasmid (p208p21ML) and purified core histones using an ACF/NAP1 chromatin assembly system. Micrococcal nuclease digestion and agarose gel electrophoresis analyses of the assembled chromatins with different ratios of DNA to histone were performed (bottom panel). b SDS-PAGE/Coomassie blue staining of purified transcription factors and MSK1. c Reactions containing substrate (histone octamer or chromatin), a transcription activator, and MSK1 (rMSK1, recombinant MSK1; cMSK1, cellular MSK1 activated by MKK6ca co-expression), where indicated, were subjected to in vitro kinase assays. For histone octamer and chromatin substrates, 5 ng and 50 ng, respectively, of MSK1 were added. The protein components and the level of H3S10 phosphorylation in each reaction were examined by immunoblotting with the indicated antibodies. The total histone amounts are shown by protein staining of the membrane. d SDS-PAGE/Coomassie blue staining of purified GST and GST-p53 (left panel). Binding of FLAG-MSK1 to GST-p53 vs. GST was monitored by immunoblotting with anti-MSK1 antibody (right panel). e Intracellular association of p53 and MSK1. HEK293T cells were transfected with plasmids expressing FLAG-MSK1 and HA-p53 as indicated. Cell extracts were incubated with M2 agarose, and the bound proteins were scored by immunoblotting with the indicated antibodies. f ChIP analyses of p53 and MSK1 on the p21 locus during p53-dependent transcription. A schematic representation of the p21 locus with the three amplicons (indicated by asterisks) used for ChIP-qPCR (top panel). HCT116 colorectal cancer cells expressing p53 (p53+/+) were treated with doxorubicin for the indicated times and ChIP analyses were performed with the indicated antibodies (bottom panels). Error bars indicate the SDs from three independent ChIP analyses. ChIP analysis with IgG showed negligible signals (data not shown). The statistical significance of the MSK1 recruitment upon doxorubicin treatment was evaluated by Student’s t-test. RE responsive element

