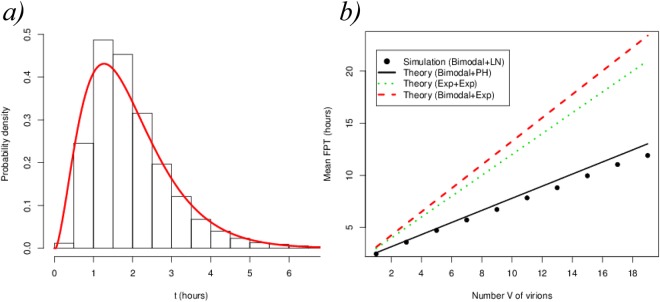
Figure 10.
(a) Bars: histogram of the log-normal distribution log with m = 0.57 h, σ = 0.5 h so that 1/μ = 2 h. Red solid line: probability density of the three-dimensional PH(α, T) approximation of the log-normal distribution. (b) Black circles: simulation of case study 2 with a mixture of Gaussian distributions for budding events and a log-normal one for the recovery events. The black solid line represents the theoretical prediction when replacing the log-normal by a PH distribution in panel (a). The red dashed line represents the theoretical prediction using a mixture of Gaussian distributions for the budding event and an exponential one for the recovery transition. The green dotted line represents the complete Markovian hypothesis.

