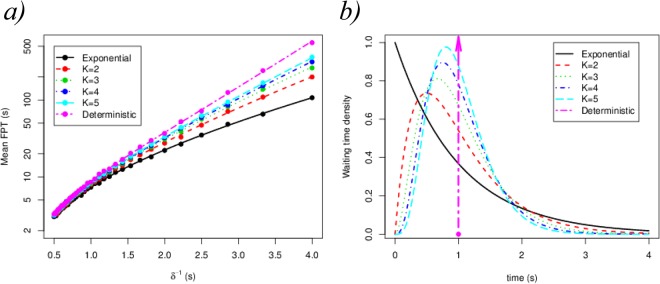
Figure 5.
(a) Mean FPT from pre-binding (state 0) until signalling (state ) for the model described in Fig. 4b. The probability distributions considered for the absolute waiting time are shown in panel (b). Every waiting time distribution, G, in panel (b) has the same mean, , but different shape. The value K refers to the shape parameter of the gamma distribution ( corresponds to the exponential distribution). We have considered , and for all k in Fig. 4, for illustrative purposes.

