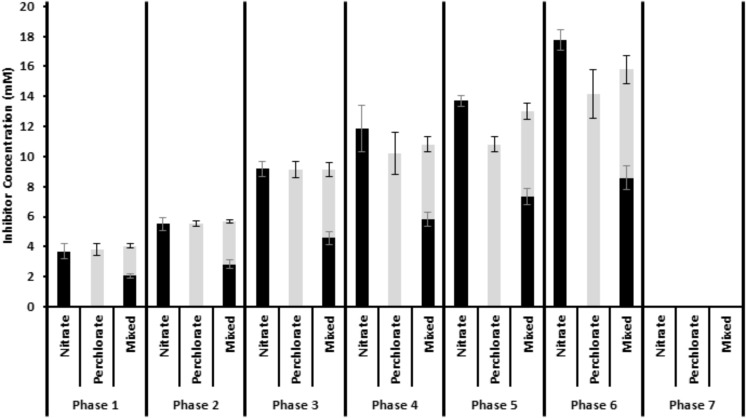
FIGURE 1.
Influent inhibitor concentrations throughout the treatment phases. Nitrate is shown in black and perchlorate is shown in gray. The mixed treatment shows the combination of the two treatments. Error is standard deviation of weekly influent bottle measurements over the entire treatment phase.

