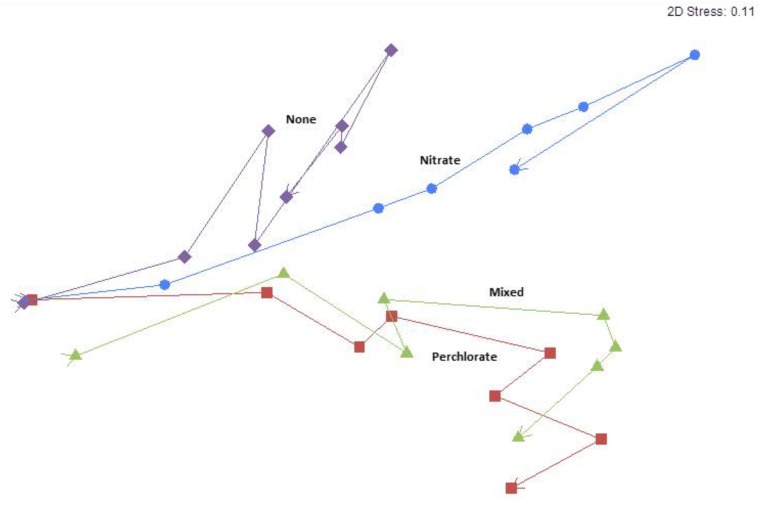
FIGURE 4.
Means non-metric multidimensional scaling plot of each treatment over time/treatment phase from pre-treatment to phase 7. Arrows indicate directionality from Pretreatment toward phase 7 and each point represent an average value for all samples from that treatment phase. Blue circles represent the nitrate treatment, red squares represents perchlorate treatment, green triangles represents mixed treatments, and purple diamonds represent no treatment. The stress value in the upper right hand corner indicates goodness of fit to the data with 0 representing a perfect fit and 0.3 representing a random fit.

