FIGURE 2.
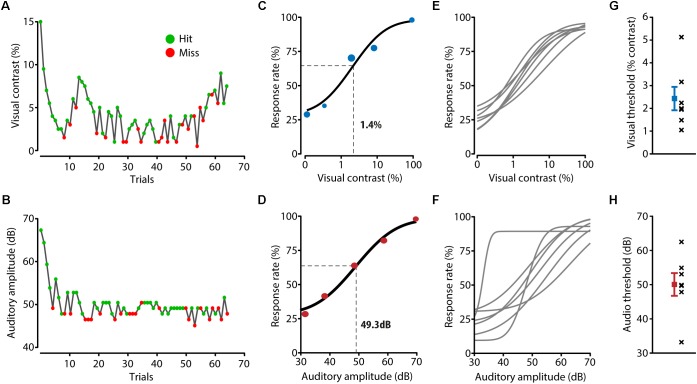
Detection performance for unisensory stimuli. (A,B) During a behavioral session, two adaptive staircase procedures were running in parallel for presenting visual (A) and auditory (B) stimuli around the perceptual threshold of the mouse. Green dots indicate trials in which the mouse licked in response to the stimulus, red dots indicate trials during which no response registered. (C) The visual perceptual threshold was determined by fitting a psychometric function to the response rate calculated for the binned visual stimulus contrast. Visual contrast was log10 transformed to allow for a better fit. The example mouse shown here has a visual threshold of 1.4%, determined as the point half way the fitted curve. (D) Example psychometric function and threshold calculation for auditory trials. (E,F) Fitted psychometric functions for all mice (n = 7). (G) Visual thresholds for all individual mice (black crosses) and the mean and SEM (in blue) over mice. (H) Auditory thresholds for all mice (black crosses) and the mean and SEM (in red) over mice.

