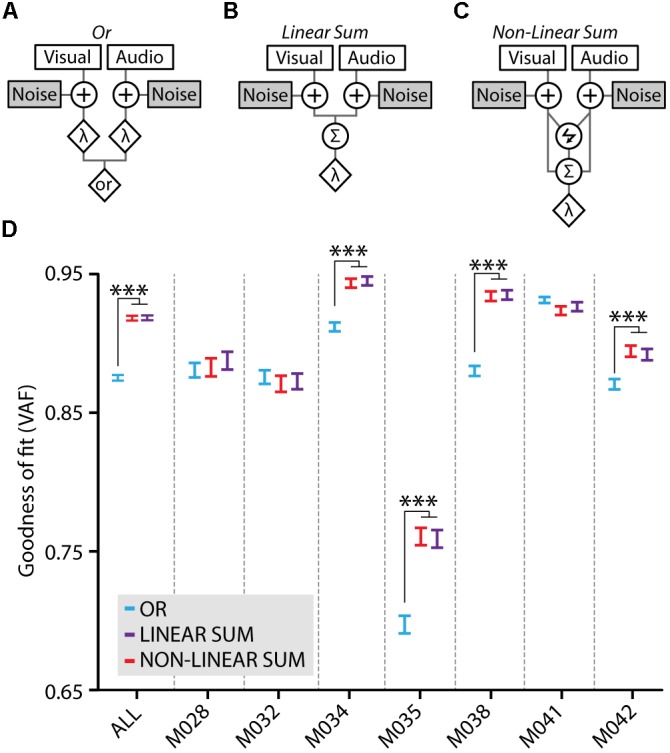
FIGURE 5.

Model fits to the behavioral data. (A) The Or model treats the visual and auditory inputs as two separate channels which both perform an independent detection of the stimulus when either the visual or the auditory component crosses the threshold (λ). Both channels are contaminated with independent noise. (B) In the Linear Sum model visual and auditory signals are integrated using linear summation. Independent early noise is added to the sensors and the two signals are summed using a weighted linear sum (Σ) after which a single multisensory threshold (λ) determines whether a response is made. (C) The Non-linear Sum model adds a multiplication factor (lightning symbol) to the visual and auditory summation. Models adapted from Jones (2016). (D) Model fits to the average behavioral data of all mice (ALL) quantified as variance accounted for (VAF), higher values indicate a better model fit. Fits for the behavioral data of individual mice are also shown, the data of four mice show a significantly better fit for the Linear Sum (purple) and the Non-linear Sum (red) compared to the Or model (blue; one-way ANOVA with post hoc Tukey–Kramer, ∗∗∗p < 0.001).
