Figure 5.

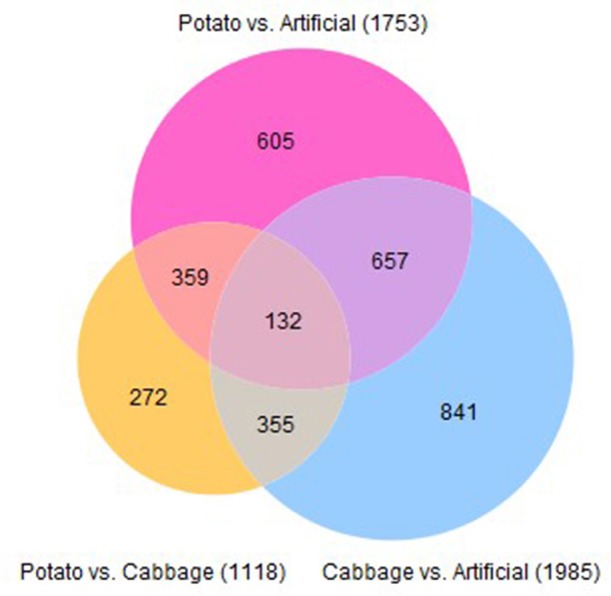
Venn diagram describing the number of contigs significantly differentially expressed in midguts of 4th instar T. ni raised on three diets.

Venn diagram describing the number of contigs significantly differentially expressed in midguts of 4th instar T. ni raised on three diets.