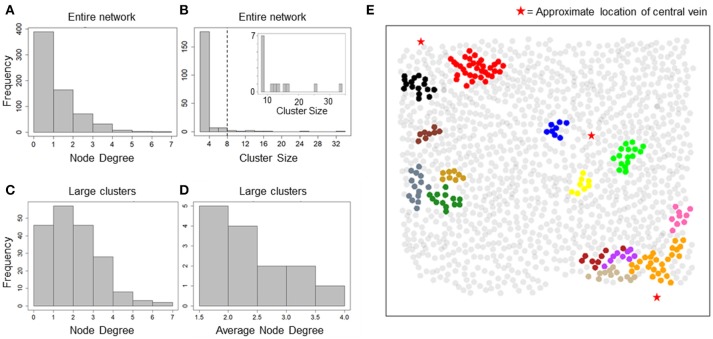
Figure 2.
Cluster sizes and degree distribution for correlation-based network. (A) Node degree distribution for all nodes in the correlation network. A majority of nodes exhibit a degree < = 2; (B) cluster size distribution for all isolated clusters. Most clusters consist of 2 nodes and 1 edge. 14 clusters consisted of > = 8 hepatocytes (inset); (C) Node degree distribution for hepatocytes residing in large clusters found in the correlation network. Degree of synchronization for hepatocytes with their neighbors is frequently > = 3; (D) Average node degree distribution for large clusters. Nine out of Fourteen clusters show average degree > 2; (E) Clusters in correlation network mapped to their physical locations. Hepatocytes are represented as circles centered at their locations in the imaged field. Red stars mark the approximate locations of central veins (CV) in the imaged area. Hepatocytes belonging to a cluster have been plotted in the same color. Synchronized “islands” of hepatocytes cover only small regions of the imaged area.

