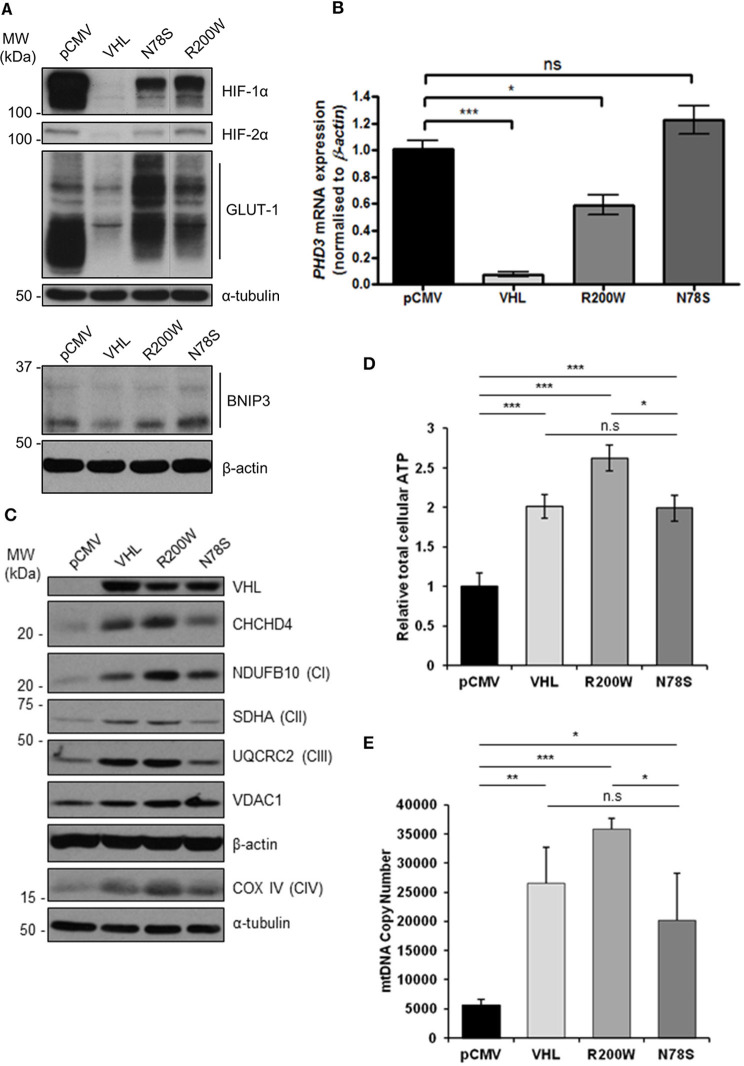
Figure 4.
pVHL mutants differentially regulate mitochondrial protein expression, mtDNA copy number and ATP levels. (A) Western blots show HIF-1α, HIF-2α, GLUT-1, and BNIP3 protein levels in RCC10 cells expressing empty vector (pCMV), wild type pVHL (VHL), or pVHL mutants (R200W or N78S). α-tubulin and β-actin were used as load controls. (B) Relative expression of PHD3 mRNA in RCC10 cells described in (A), measured using RT-qPCR. Data were analyzed using the comparative Ct method. Data are presented as mean ± S.E.M. n = 3 (n.s. p > 0.05, *p < 0.05, and ***p < 0.001). (C) Western blots show expression of mitochondrial proteins CHCHD4 and VDAC1, and respiratory chain subunits NDUFB10 (CI), SDHA (CII), UQCRC2 (CIII), COX IV (CIV) in RCC10 cells described in (A). pVHL expression was assessed as a control for re-expression, and β-actin and α-tubulin were used as load controls. (D) Graph shows total cellular ATP content in RCC10 cells expressing wild type pVHL (VHL) or pVHL mutants (R200W or N78S), normalized to cell number (n = 4). (E) Graph shows mtDNA copy number in RCC10 cells expressing pVHL variants, calculated using the ratio of expression of mitochondrial ND1 gene to the single copy nuclear gene, β2M to by RT-qPCR. Data in (D,E) are presented as mean ± S.D. n = 6 (n.s. p > 0.05, *p < 0.05, **p < 0.01, and ***p < 0.001).

