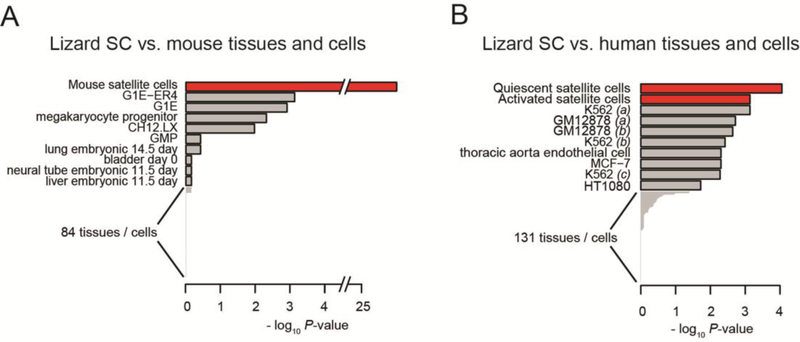
Figure 1. XGSA analyses comparing the transcriptome from lizard satellite cells to multiple tissues from the mouse and human ENCODE projects.
XGSA comparison of marker genes with 94 mouse (A), and 139 human (B) tissues reveals that the lizard satellite cell transcriptome (Hutchins et al., 2014) displayed highest similarity with mouse and human satellite cells. Depicted are the top 10 most similar for each species comparison. For complete comparisons see Supplemental Figure 1. Parentheses after sample names are used to differentiate replicate transcriptomes.

