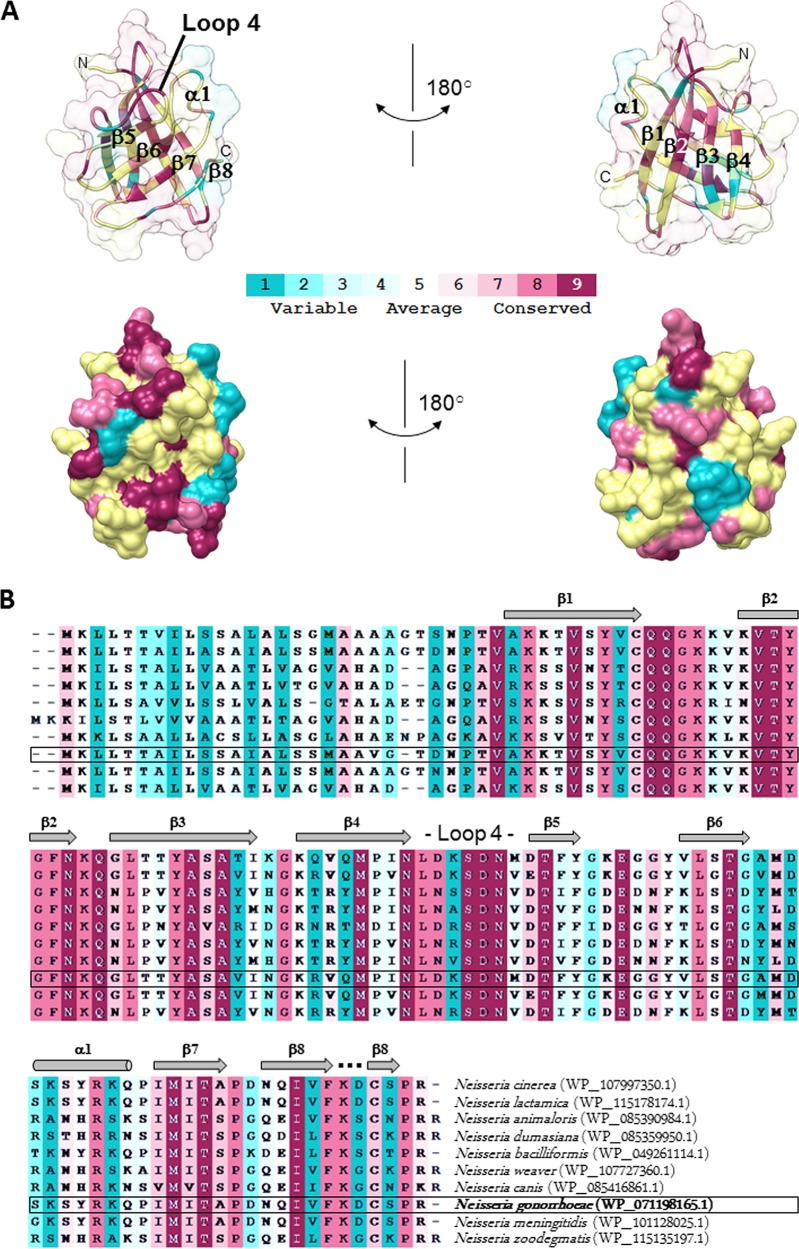
FIG 4.
Structure conservation mapping of ACP proteins from different Neisseria species. The conservation was calculated by ConSurf (18) and is color coded as shown in the scale from blue (variable) to red (conserved), where average regions are shown in white (compare methods). (A) Structure of Ng-ACP in the same orientation as seen in Fig. 2, shown as a cartoon with transparent surface (top) and as surface (bottom) in two orientations rotated by 180 degrees around the vertical axis in the paper plane. The conservation mapping is based on the sequence alignment shown in panel B.

