
Figure 2.
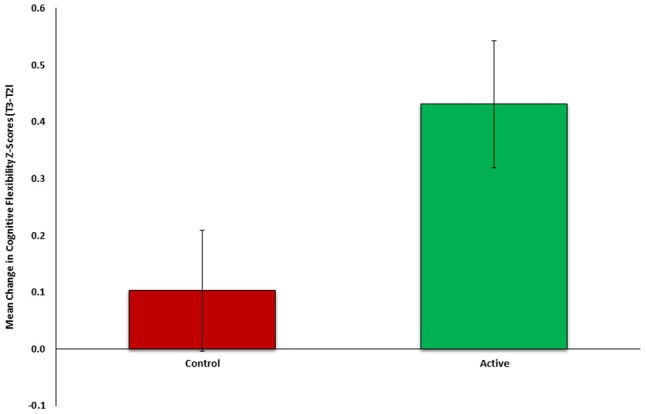
Mean change in cognitive flexibility after intervention (T2-Tl) between active (n = 26, green) and control (n = 27, red) groups of Study 2.
Official websites use .gov
A
.gov website belongs to an official
government organization in the United States.
Secure .gov websites use HTTPS
A lock (
) or https:// means you've safely
connected to the .gov website. Share sensitive
information only on official, secure websites.
Mean change in cognitive flexibility after intervention (T2-Tl) between active (n = 26, green) and control (n = 27, red) groups of Study 2.