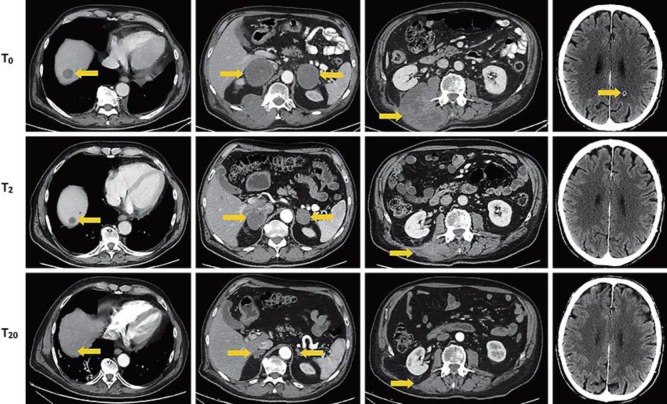
Fig. 2.
Abdomen and brain CT scans. T0 images are related to the clinical status before nivolumab (March 21, 2016), T2 images refer to the situation after 2 months (May 20, 2016), and T20 images describe the tumor after 20 months (November 16, 2017). In the left column, images refer to the CT follow-up on the hepatic lesion (arrow), then the adrenal gland lesions (arrow), and the lesion of right paravertebral muscle (arrow). In the right column, images refer to the CNS lesion (arrow) before nivolumab therapy (T0), after 4 cycles (T2), and after 34 cycles (T20).

