
Fig. 3.
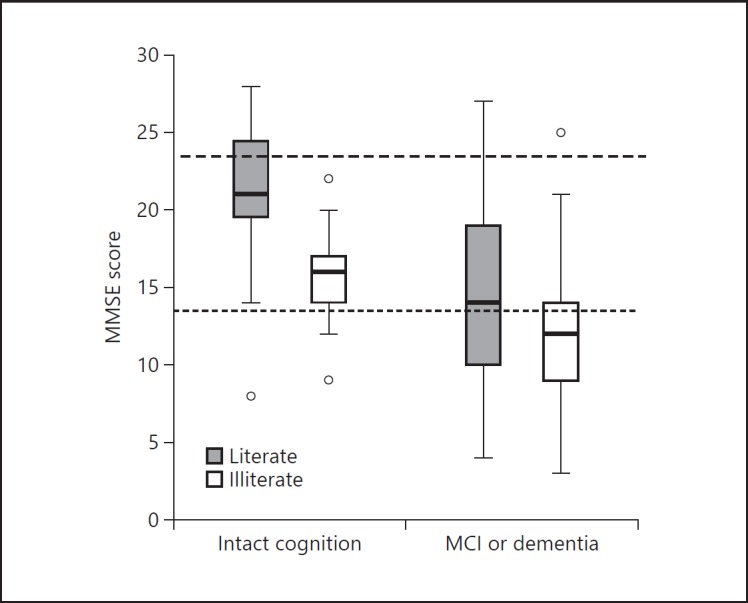
Boxplot of MMSE scores for patients with intact cognition versus patients with MCI/dementia stratified by literate and illiterate subjects. Boxes represent the 25th-75th percentile, bars represent minimal and maximum values, circles represent outliers. The upper dashed line represents the standard cutoff score of < 24 and the lower dashed line the optimal cutoff score based on Youden's index in our study (< 14).