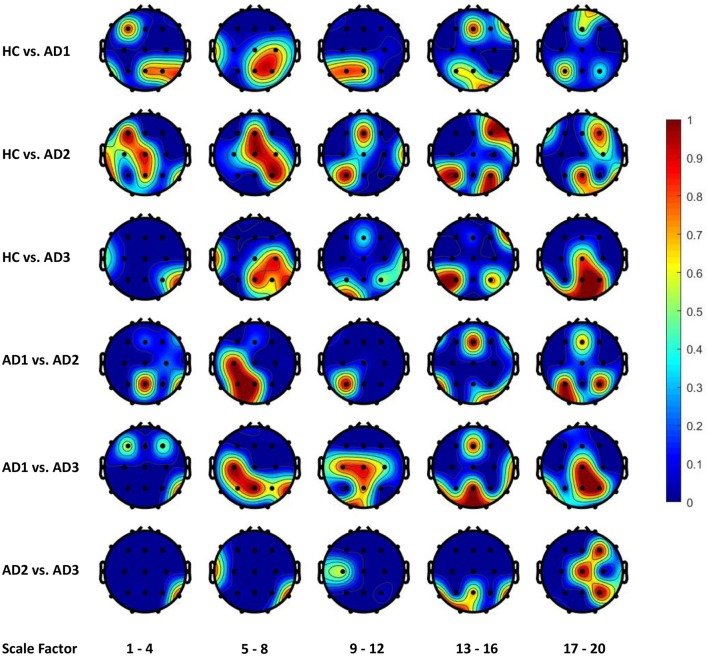
Figure 4.
The frequency distribution of MSE features selected by LASSO across brain regions. The plotted values are the ratio of being selected in cross validation for each electrode and scale factors; we categorize the 20 scale factors (MSE features) into 5 bins; the plotted value for each bin is the maximal frequency within the bin. For instance, if scale factors 1, 2, 3, and 4 computed using channel O1 is selected in 30, 50, 70, and 90% of all replications in cross-validation, the value assigned to channel O1 will be 0.9 for the scale factors 1–4.

