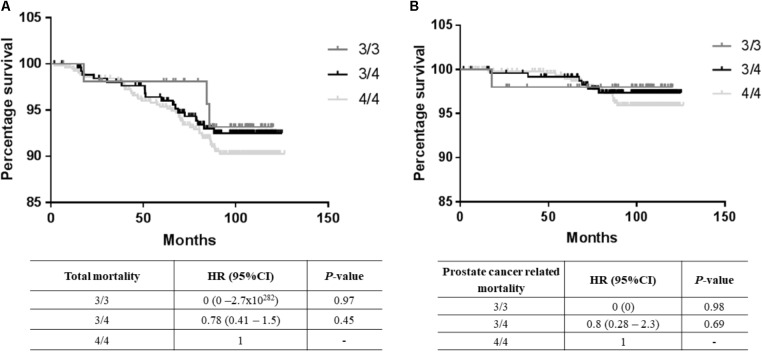
FIGURE 2.
Survival data analysis. (A) Total mortality data [Log-Rank (Mantel-Cox) P-value = 0.16], (B) prostate cancer mortality data [Log-Rank (Mantel-Cox) P-value = 0.43] where TTTTG-TRIB1 genotypes (3/3, 3/4, 4/4) are represented as a function of percentage survival over 125 months. HR and P-values were calculated using Cox-Regression analysis and adjusted for age, Gleason score and PSA values. HR, hazard ratio; CI, confidence interval.

