-
A
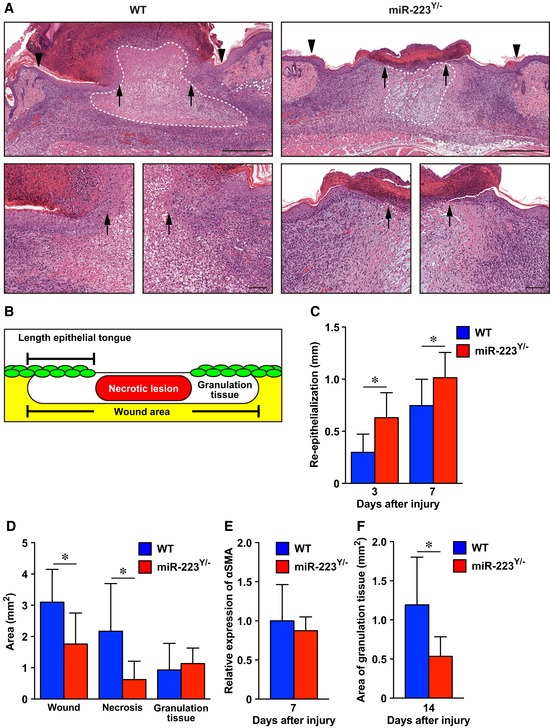
H&E staining of re‐epithelialization at day 7 after injury (wound margin (arrowheads) and the leading edge of epithelia (arrows)). Dotted line indicates pathological necrotic lesion. Scale bars: 500 μm (top) and 100 μm (bottom).
-
B
Schematic indicating the measurements derived from histological sections.
-
C
Measurement of the epithelial tongue at day 3 and day 7 after injury in WT (day 3; n = 4, day 7; n = 8) and miR‐223
Y/− (day 3; n = 5, day 7; n = 6) mice.
-
D
Measurement of the total wound area, necrotic lesion area, and granulation tissue area at day 7 after injury in WT neutrophil‐transplanted and miR‐223
Y/− neutrophil‐transplanted wounds (n = 6).
-
E
Quantification of the expression of αSMA at day 7 in S. aureus‐infected wound sites from WT (n = 6) and miR‐223
Y/− mice (n = 7).
-
F
Measurements of the granulation tissue area at day 14 in WT (n = 7) or miR‐223
Y/− wound sites (n = 5).
Data information: All values represent the mean ± SD. Unpaired
t‐tests were used to generate
P‐values indicated in the Figure. *
P < 0.05.

