-
A
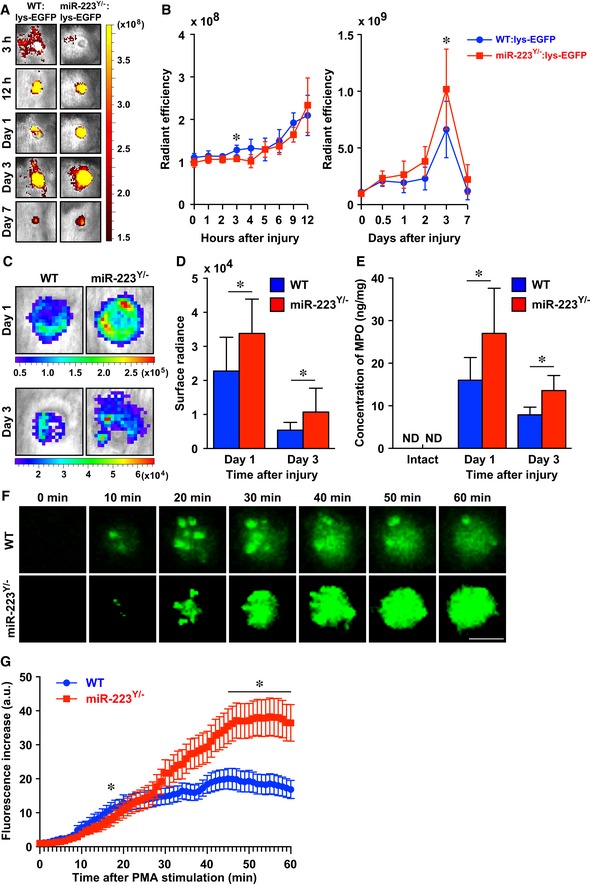
Representative in vivo fluorescent images of EGFP‐expressing neutrophils at skin wound sites. Active fluorescent imaging on color scale overlaid on a gray scale image of wounds sites.
-
B
Recruitment of neutrophils at skin wound sites measured by in vivo fluorescence. All values indicate the mean radiant efficiency (photon/sec/cm2/sr)/(uW/cm2) (n = 3).
-
C
Representative in vivo MPO activity bioluminescence imaging on color scale overlaid on a gray scale image of wound sites.
-
D
Measurements of MPO activity in vivo at wound sites of WT and miR‐223
Y/− mice. All values are the mean surface radians (photon/sec/cm2/sr) (day 1; n = 9, day 3; n = 12).
-
E
MPO concentrations measured by ELISA revealed MPO levels of miR‐223
Y/− mice were significantly increased compared with WT mice (intact skin; n = 4, day 1; n = 5 (miR‐223
Y/−) or n = 8 (WT), day 3; n = 6 (miR‐223
Y/−) or n = 5 (WT)).
-
F
Representative live
in vitro fluorescence imaging of ROS production in WT and
miR‐223
Y/−‐derived neutrophils (
Movies EV1 and
EV2). Scale bar: 10 μm.
-
G
Temporal ROS production in neutrophils from WT (32 neutrophils from 3 mice, blue) and miR‐223
Y/− (36 neutrophils from 3 mice, red) mice were measured at 60 min after PMA stimulus.
Data information: Values represent the mean ± SD (B, D, and E), or ± SEM (G). Two‐way ANOVA followed by Sidak multiple test (B), unpaired
t‐test (B, D, and E), and Mann–Whitney
U‐test (G) were used to generate
P‐values indicated in the Figure. *
P < 0.05.

