-
A
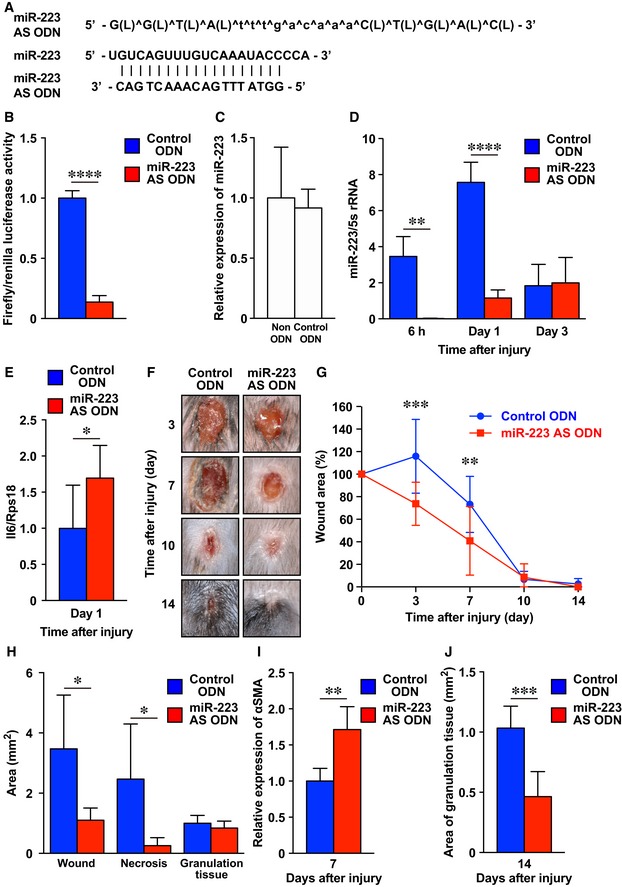
L, and ^ indicate LNA, and phosphorothioated ODN, respectively. Alignment of miR‐223 AS ODN sequences and the corresponding sequences in mature miR‐223.
-
B
Confirmation of miR‐223 AS ODN binding activity in vitro. miR‐223 AS ODN binds to the mature miR‐223 region with a high affinity. A luciferase reporter vector encoding the mature miR‐223 was co‐transfected with miR‐223 AS ODN into 3T3 cells. A decrease in luciferase activity indicates binding of the control ODN to the target sequence (n = 4).
-
C
Expression of miR‐223 in PB gel or control ODN‐treated S. aureus‐infected wound sites using qPCR (n = 4).
-
D
Temporary expression of miR‐223 in control ODN or miR‐223 AS ODN‐treated S. aureus‐infected wound sites using qPCR (n = 4).
-
E
Expression of Il6 at day 1 in control ODN or miR‐223 AS ODN‐treated S. aureus‐infected wound sites using qPCR (n = 4).
-
F
Representative photo images of the gross appearances of control and miR‐223 AS ODN‐treated wounds at various time points after wounding (n = 7).
-
G
The proportion of the wound area remaining open relative to the initial S. aureus‐infected wound area at each time point after the injury in control ODN versus miR‐223 AS ODN‐treated wounds (n = 7).
-
H
Measurement of total wound area, necrotic lesion area, and granulation tissue area at day 7 after injury in control ODN or miR‐223 AS ODN‐treated S. aureus‐infected wound sites (n = 6).
-
I
Quantification of the expression of αSMA at day 7 in control ODN (n = 5) or miR‐223 AS ODN‐treated S. aureus‐infected wound sites (n = 6).
-
J
Measurement of the area of granulation tissues at day 14 in control ODN or miR‐223 AS ODN‐treated S. aureus‐infected wound sites (n = 6)
Data information: All values represent the mean ± SD. Unpaired
‐tests (B, D, E, I, and J) followed by Welch's correction (H) and two‐way ANOVA followed by Sidak multiple test (G) were used to generate the
‐values indicated in the Figure. *
< 0.0001.

