
Figure 3.
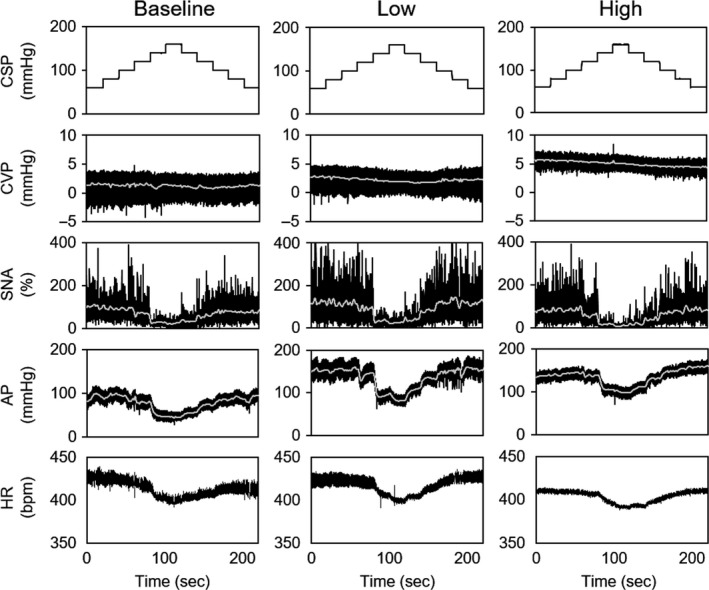
Time series data of CSP, CVP, SNA, AP, and HR at baseline (A), low (B), and high (C) volume loading conditions. CSP was changed stepwise from 60 to 160 mmHg and then back to 60 mmHg with step size of 20 mmHg. SNA measured was normalized by baseline SNA at CSP = 60 mmHg (100%). CSP, carotid sinus pressure; CVP, central venous pressure; SNA, sympathetic nerve activity; AP, arterial pressure. HR, heart rate.