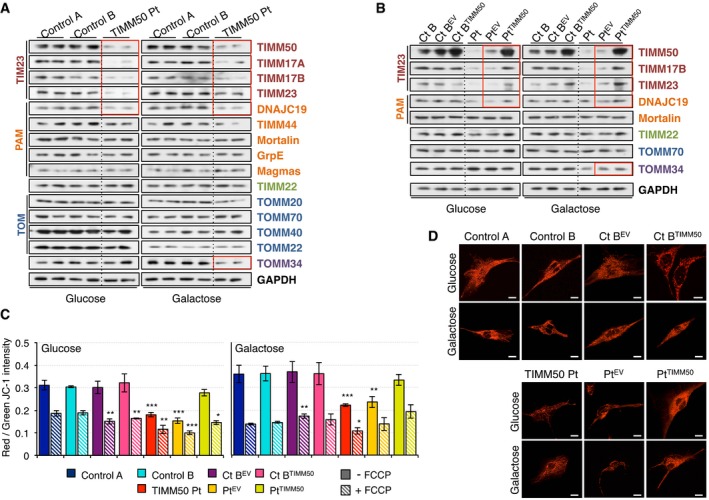
Figure 2. Decreased TIM23 complex and membrane potential in TIMM50 mutant fibroblasts.

-
AWestern blot of whole cell extracts for different components of the protein import machinery in control and TIMM50 mutant fibroblasts grown in either glucose‐ or galactose‐containing medium.
-
BWestern blot of whole cell extracts for different components of the protein import machinery in control and TIMM50 mutant fibroblasts, transduced with the empty vector (EV) or with wild‐type TIMM50 grown in either glucose‐ or galactose‐containing medium.
-
CMitochondrial membrane potential in fibroblasts grown in glucose or galactose using JC‐1 staining in untreated or FCCP‐treated conditions. Data are shown as mean ± SD, n = 4 biological replicates; *P < 0.05, **P < 0.01, ***P < 0.001, Student's unpaired two‐tailed t‐test. Exact P‐values are reported in Table EV1.
-
DTMRM live staining of control and TIMM50 mutant fibroblasts, transduced with the empty vector (EV) or with wild‐type TIMM50 grown in either glucose‐ or galactose‐containing medium. Scale bar corresponds to 10 μm. A digitally enhanced TMRM image from TIMM50 mutant fibroblasts is shown in Appendix Fig S4B.
Source data are available online for this figure.
