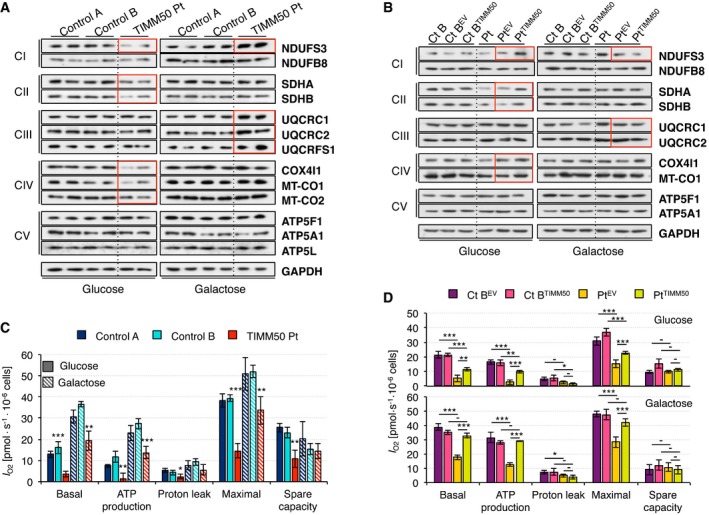
Figure 4. Altered OxPhos protein level and respiration in TIMM50 mutant fibroblasts.

-
AWestern blot for representatives of all five respiratory complexes in control and TIMM50 mutant fibroblasts grown in glucose or galactose. Two biological replicates are shown for each cell line and condition. Significant changes in protein levels in TIMM50 mutant fibroblasts compared to controls have been boxed in red. The quantification is shown in Appendix Fig S3A.
-
BWestern blot for representatives of all five respiratory complexes in control and TIMM50 mutant fibroblasts, transduced with the empty vector (EV) or with wild‐type TIMM50 grown in glucose or galactose. Two biological replicates were obtained for each cell line and condition. Significant changes in protein levels in TIMM50 mutant fibroblasts complemented with TIMM50 compared to EV have been boxed in red. The quantification is shown in Appendix Fig S3B.
-
COxygen consumption measurements in control and TIMM50 mutant fibroblasts grown in glucose or galactose. Values of basal and maximal respiration along with ATP production‐dependent, proton leak respiration, and spare capacity are shown. Data are shown as mean ± SD, n = 4 biological replicates; *P < 0.05, **P < 0.01, ***P < 0.001 grouping both controls together, Student's unpaired two‐tailed t‐test. Exact P‐values are reported in Table EV1.
-
DOxygen consumption measurements in control and TIMM50 mutant fibroblasts, transduced with the empty vector (EV) or with wild‐type TIMM50 grown in glucose or galactose. Values of basal and maximal respiration along with ATP production‐dependent, proton leak respiration, and spare capacity are shown. Data are shown as mean ± SD, n = 4 biological replicates; *P < 0.05, **P < 0.01, ***P < 0.001, Student's unpaired two‐tailed t‐test. Exact P‐values are reported in Table EV1.
Source data are available online for this figure.
