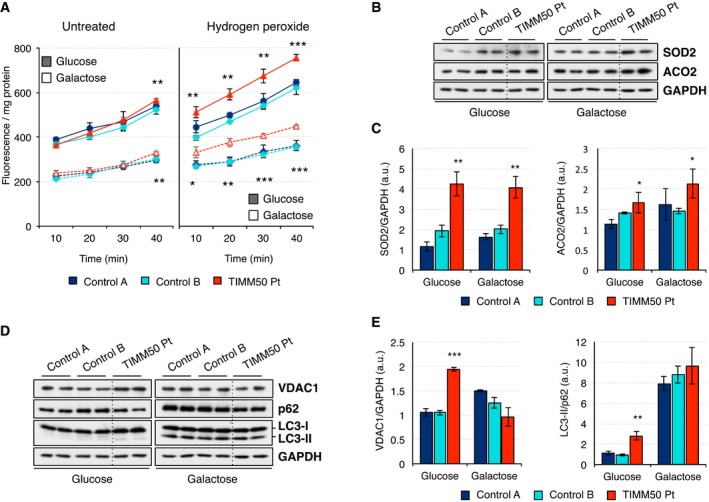
Figure 5. Increased ROS production and mitophagy in TIMM50 mutant fibroblasts.

-
AROS production as measured by intracellular oxidation of the cell‐permeant probe DCFDA in control and TIMM50 mutant fibroblasts grown in glucose or galactose. Measurements were made in untreated cells and after treatment with 250 μM hydrogen peroxide for 30 min. Data are shown as mean ± SD, n = 3 biological replicates; *P < 0.05, **P < 0.01, ***P < 0.001 grouping both controls together, Student's unpaired two‐tailed t‐test. Exact P‐values are reported in Table EV1.
-
BSteady‐state levels of ROS‐related proteins SOD2 and ACO2 in control and TIMM50 mutant fibroblasts growing in either glucose or galactose were assessed by Western blot using GAPDH as internal control.
-
CQuantification of the steady‐state levels of SOD2 and ACO2 in control and TIMM50 mutant fibroblasts growing in either glucose or galactose. Data are shown as mean ± SD, n = 4 biological replicates; *P < 0.05, **P < 0.01 grouping both controls together, Student's unpaired two‐tailed t‐test. Exact P‐values are reported in Table EV1.
-
DSteady‐state levels of mitophagy‐related proteins VDAC1, p62, and LC3‐II in control and TIMM50 mutant fibroblasts growing in either glucose or galactose were assessed by Western blot using GAPDH as internal control. GAPDH is from the same blot as panel (B).
-
EQuantification of the steady‐state levels of VDAC1, p62, and LC3‐II in control and TIMM50 mutant fibroblasts growing in either glucose or galactose. Data are shown as mean ± SD, n = 4 biological replicates; **P < 0.01, ***P < 0.001 grouping both controls together, Student's unpaired two‐tailed t‐test. Exact P‐values are reported in Table EV1.
Source data are available online for this figure.
