
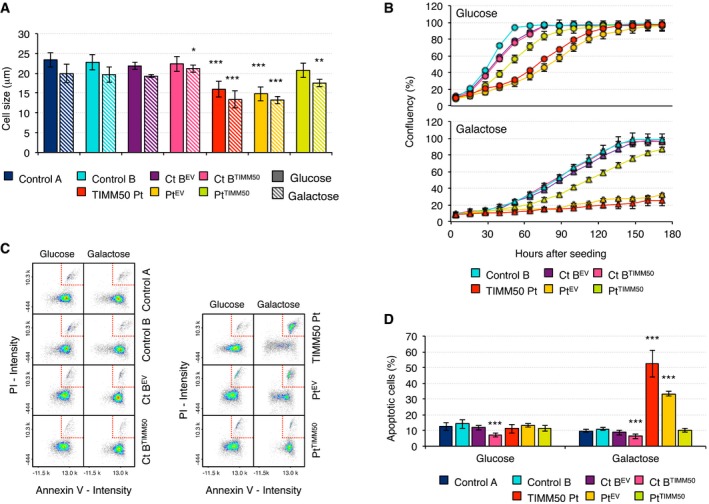
Figure 6. Cell size, cell growth, and apoptosis in TIMM50 mutant fibroblasts.
-
ACell size in control and TIMM50 mutant fibroblasts, transduced with the empty vector (EV) or with wild‐type TIMM50 grown in glucose or galactose. Data are shown as mean ± SD, n = 5 biological replicates; *P < 0.05, **P < 0.01, ***P < 0.001, Student's unpaired two‐tailed t‐test. Exact P‐values are reported in Table EV1.
-
BGrowth curves of control and TIMM50 mutant fibroblasts, transduced with the empty vector (EV) or with wild‐type TIMM50 grown in glucose or galactose. Cell growth was monitored continuously by the Incucyte live cell imager (Essen Bioscience). One of the three independent experiments carried out is presented. Data are shown as mean of three technical replicates ± SD.
-
CPlot of Annexin V intensity against propidium iodide signal in control and TIMM50 mutant fibroblasts, transduced with the empty vector (EV) or with wild‐type TIMM50 grown in glucose or galactose. Cells in the late stage of apoptosis are boxed in the top right corner.
-
DQuantification of the number of late apoptotic cells in control and TIMM50 mutant fibroblasts, transduced with the empty vector (EV) or with wild‐type TIMM50 grown in glucose or galactose. Data are shown as mean ± SD, n = 5 or 4 biological replicates in the case of transduced cells; ***P < 0.001, Student's unpaired two‐tailed t‐test. Exact P‐values are reported in Table EV1.