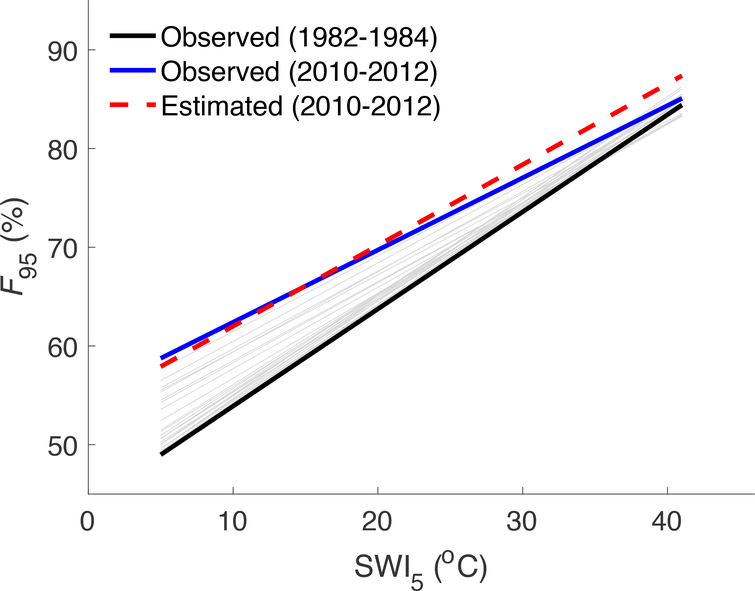
Fig. 3 |. Observed and predicted changes in F95.
Each solid line represents the observed F95 for a specific three-year period, starting from 1982–1984 (black) and ending in 2010–2012 (blue). Gray lines show F95 for intermediate three-year periods. The red dashed line represents the predicted temporal change in F95 based on the observed spatial sensitivity to SWI5 and observed long-term changes in SWI5.

