
FIGURE 1:
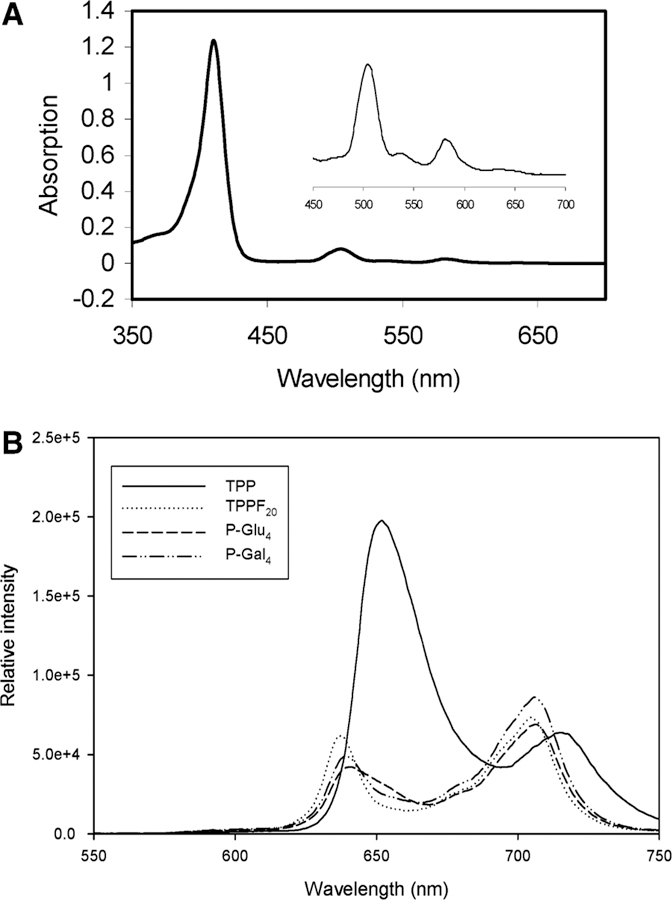
(A) UV-vis spectrum of ~2 µM P-Glu4 in methanol, where the inset is 5. (B) Fluorescence emission spectra of TPP, TPPF20, P-Glu4, and P-Gal4. The concentrations were 0.813, 0.718, 0.360, and 0.336 µM, respectively, in methanol, taken under identical instrumental conditions, and the spectra are normalized to the same molarity.