
FIGURE 7:
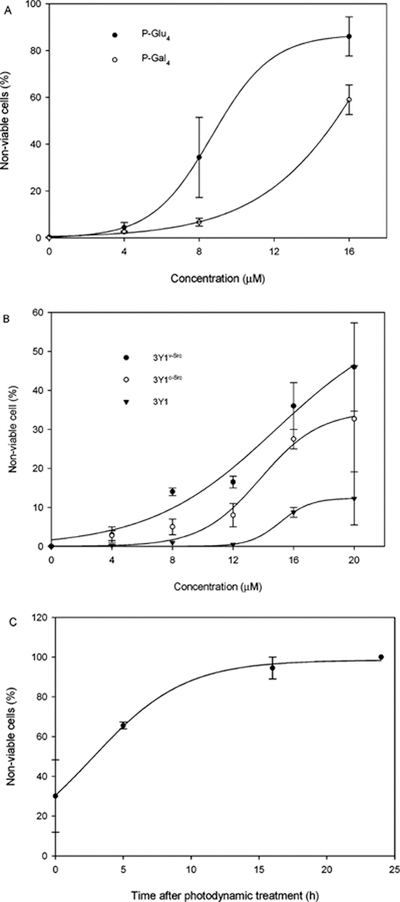
(A) Photocytotoxic effects of various concentrations of P-Glu4 and P-Gal4 on 3Y1v-Src cells are compared using 5.76 kJ m−2 white light (0.96 mW cm−2 from a 13 W fluorescent bulb for 10 min), where nonviable cells were visualized with trypan blue staining 5 h after treatment. (B) The photocytotoxic effects of various concentrations of P-Glu4 on transformed 3Y1v-Src, partially transformed 3Y1c-Src, and normal 3Y1 cells using 3.53 kJ m−2 white light (0.84 mW cm−2 from a 13 W fluorescent bulb for 7 min), where necrotic cells were visualized with trypan blue staining immediately after treatment. (C) The photocytotoxic effects of 10 µM P-Glu4 on transformed 3Y1v-Src using 11.52 kJ m−2 white light (0.96 mW cm−2 from a 13 W fluorescent bulb for 20 min). Nonviable cells were counted at various lengths of time after photodynamic treatment. Each data point represents an average ± SD from at least three independent measurements.