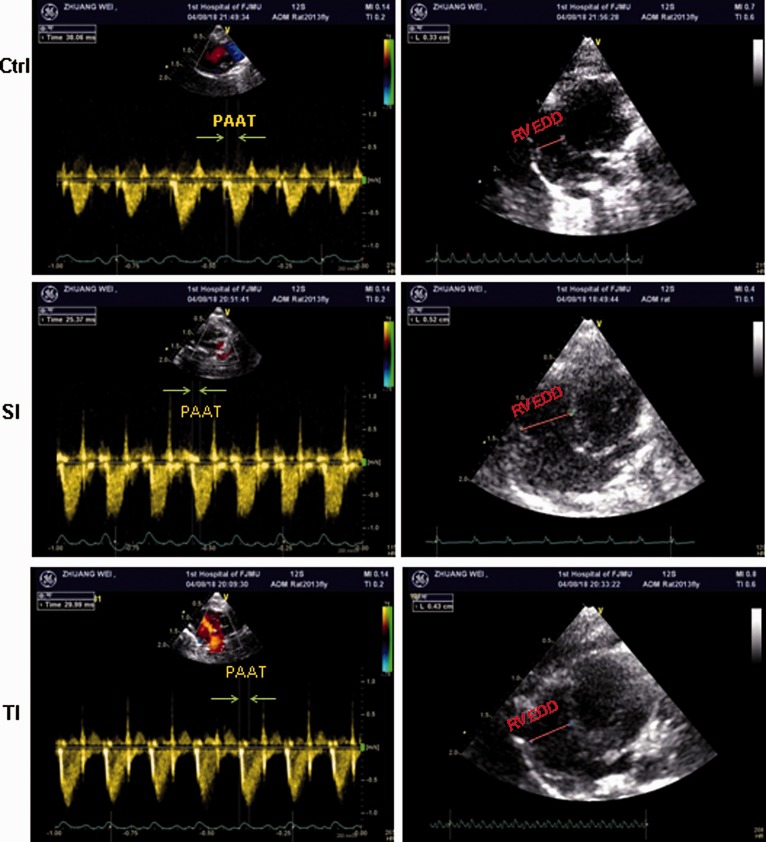
Figure 3.
Representative pulmonary blood flow spectra and a four-chamber view of heart at end-diastolic phase in pulmonary hypertensive rats induced by MCT. SD rats received normal saline (ctrl), single injection of 40 mg/kg monocrotaline (MCT) (SI group) and twice injections of 20 mg/kg (TI group). Pulmonary artery acceleration time (PAAT) and right ventricular end diastolic diameter (RVEED) are presented in the left and right panels, respectively.

