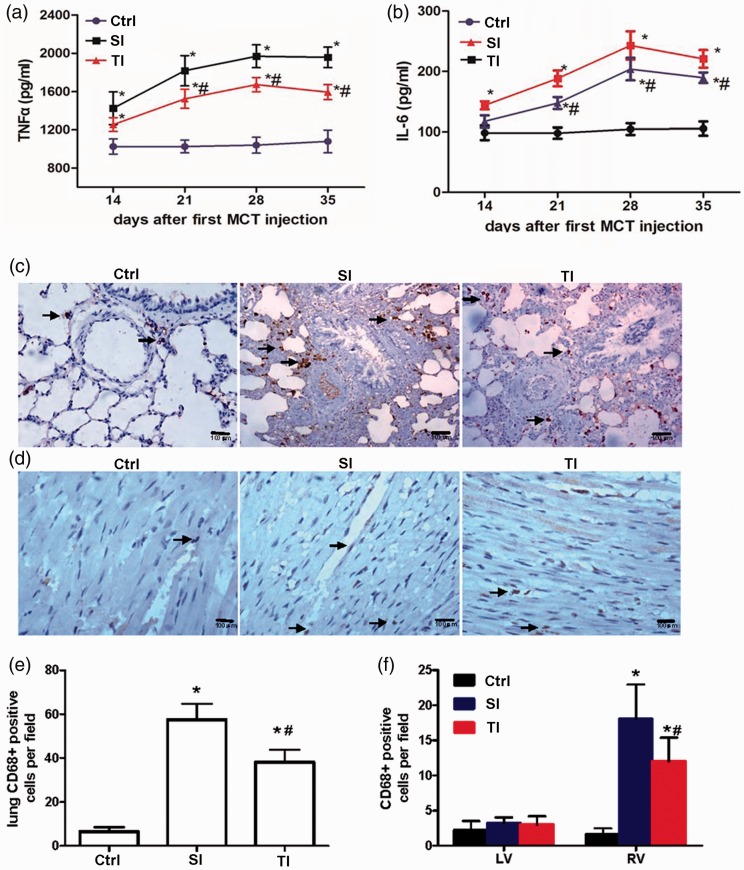
Figure 5.
Changes in inflammation during the progression of pulmonary arterial hypertension. (a, b) Serum tumor necrosis factor α (TNFα) and interleukin-6 (IL-6) were measured 7, 14, 21, 28, and 35 days after the first monocrotaline (MCT) injection. (c, d) Typical examples of lungs and right ventricle (RV) macrophage infiltration (CD68 positive cells, Arrow) in ctrl, SI, and TI groups. (e, f) Quantification of lung (e) and cardiac inflammation (f) in different groups. SI group: intraperitoneally injected with a single dose of 40 mg/kg monocrotaline (MCT); TI group: twice injections of 20 mg/kg MCT with an interval of seven days; ctrl: normal saline. Scale bar = 100 μm. *P < 0.05 vs. ctrl of the corresponding day; #P < 0.05 vs. SI group.

