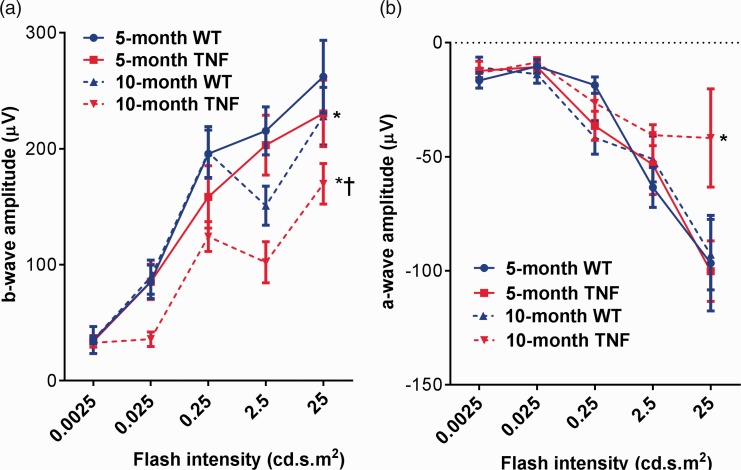
Figure 2.
Decrease in ERG amplitudes in tie2-TNF mice (a). b-wave amplitude measurement in mice expressed as μV. (b) a-wave amplitude measurement in mice expressed as μV. Data represent Mean ± SEM from n = 5 animals. *p < 0.05 compared with five-month WT mice; † p < 0.05 compared with five-month tie2-TNF mice. (A color version of this figure is available in the online journal.)
TNF: tumor necrosis factor.

