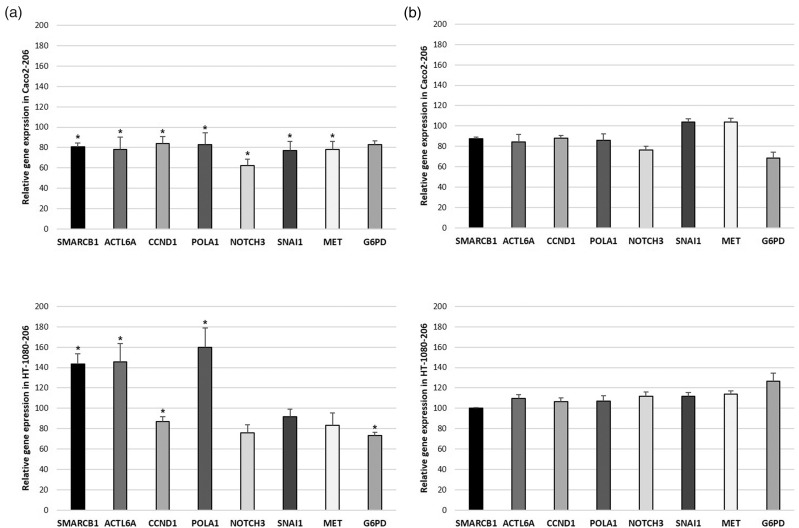
Figure 4.
Expression levels of miR-206 target genes. (a) The left column charts represent the SMARCB1, ACTL6A, CCND1, POLA1, NOTCH3, SNAI1, MET, and G6PD mRNA expression in the miR-206-transfected Caco2–206 and HT-1080–206 cell lines. (b) The right column charts illustrate these gene expressions after inhibiting miR-206. Bars represent means ± SD; *P < 0.05.

