Figure 5.
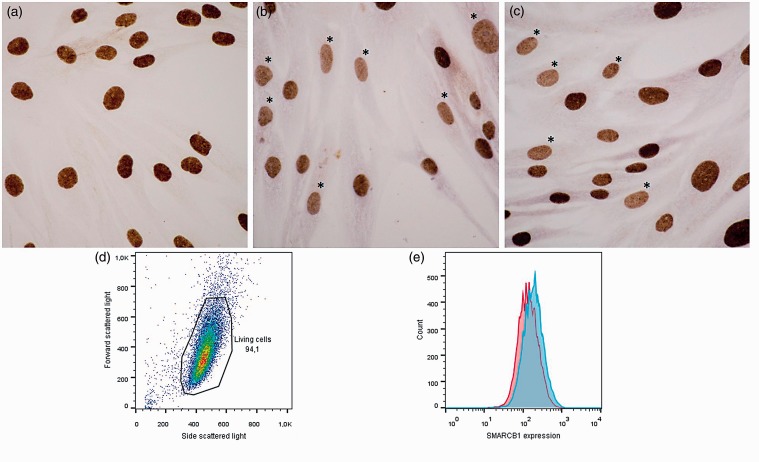
SMARCB1 immunocytochemistry and flow cytometry analysis of SS-iASC and SS-iASC-206. (a) Positive SMARCB1 staining of nuclei of not transfected SS-iASC cell line. (b and c) Between the strongly SMARCB1-immunopositive nuclei, decreased SMARCB1 protein expression was observed in individual nuclei of SS-iASC-206; (*) marks the decreased nuclear SMARCB1 expression. (d) Measurement of SMARCB1 expression by flow cytometry: gating strategy on the living cells using forward and side scattered light scattergram. (e) Fluorescence intensity of SMARCB1 in SS-iASC-206 and SS-iASC cell populations labeled with Alexa Flour® 647 conjugated goat anti-mouse IgG. The red histogram demonstrates miR-206 transfected SS-iASC-206, while the blue histogram shows the not transfected SS-iASC population. (A color version of this figure is available in the online journal.)

