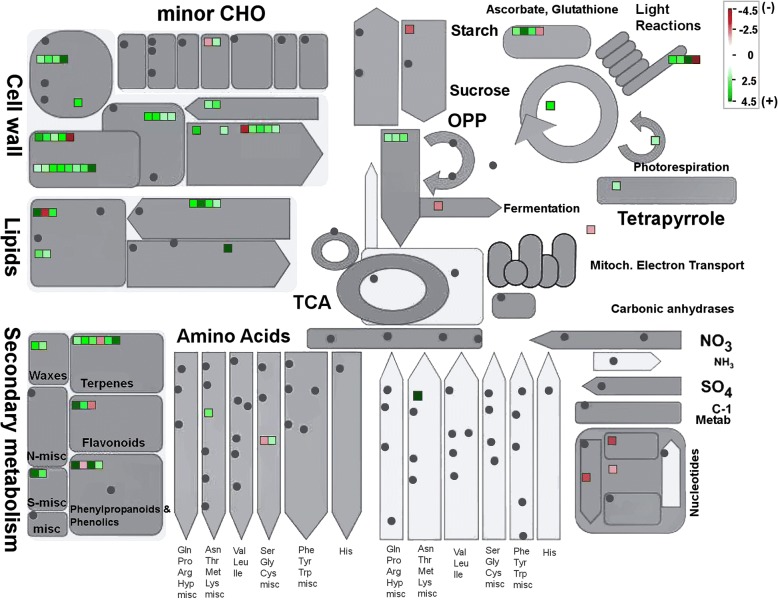
Fig. 5.
MapMan visualization of changes in transcript levels in WW-transformant compared with wild-type hop. The log2 fold changes of significantly differentially expressed genes associated with general metabolism were imported and visualized in MapMan. Red and green displayed signals represent a decrease and an increase in transcript abundance, respectively in WW-transformants (library 1: B11 and library 2: B23) relative to the wild-type of hop. The scale used for coloration of the signals (log2 ratios) is presented

