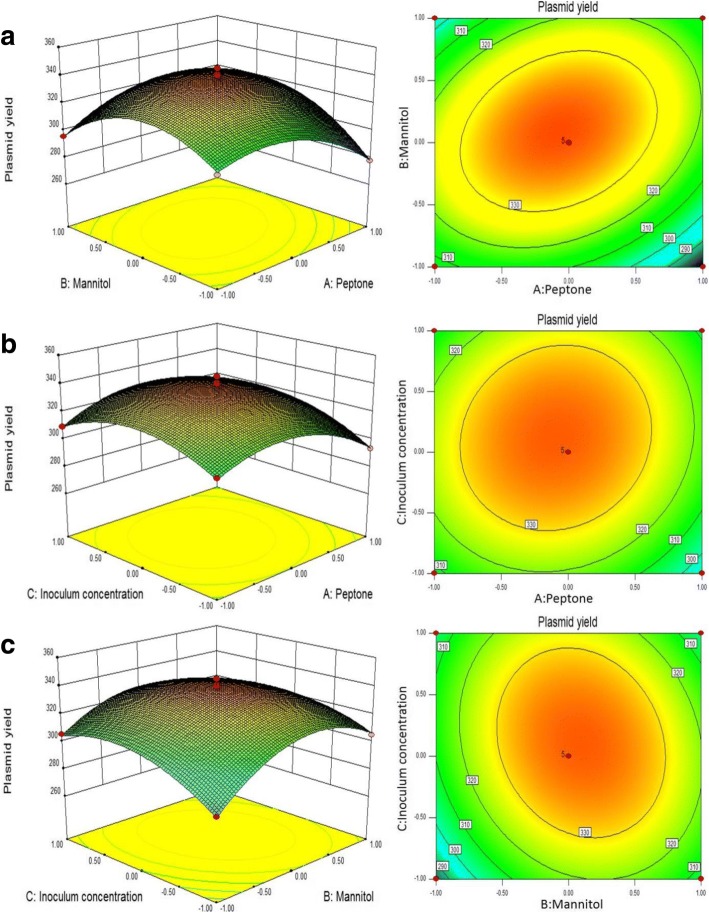
Fig. 2.
a, b, c Response surface 3D model (left) and contour plot (right) to assessthe effects of the three variables on the yield of plasmid DNA vaccine pcDNA-CCOL2A1 produced by the engineered E. coli DH5α. a response surface plot showing the mutual effect of peptone and mannitol on the yield of plasmid DNA vaccine pcDNA-CCOL2A1; b response surface plot showing the mutual effect of peptone and inoculum concentration on the yield of plasmid DNA vaccine pcDNA-CCOL2A1; c response surface plot showing the mutual effect of mannitol and inoculum concentration on the yield of plasmid DNA vaccine pcDNA-CCOL2A1

