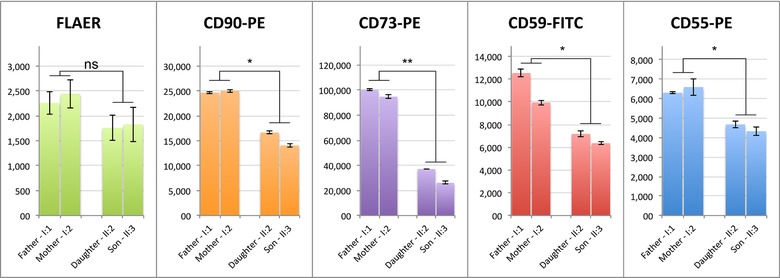
Figure 2.

GPI anchors and protein levels of GPI‐anchored markers CD55, CD59, CD73, and CD90 are reduced on fibroblast cell surfaces in affected siblings compared with healthy parents. Measurements were performed in triplicates. Significant reduction of marker expression was assessed with a t‐test, P ≤ 0.05 are marked with *; P ≤ 0.01 are marked with **
