Fig. 1.
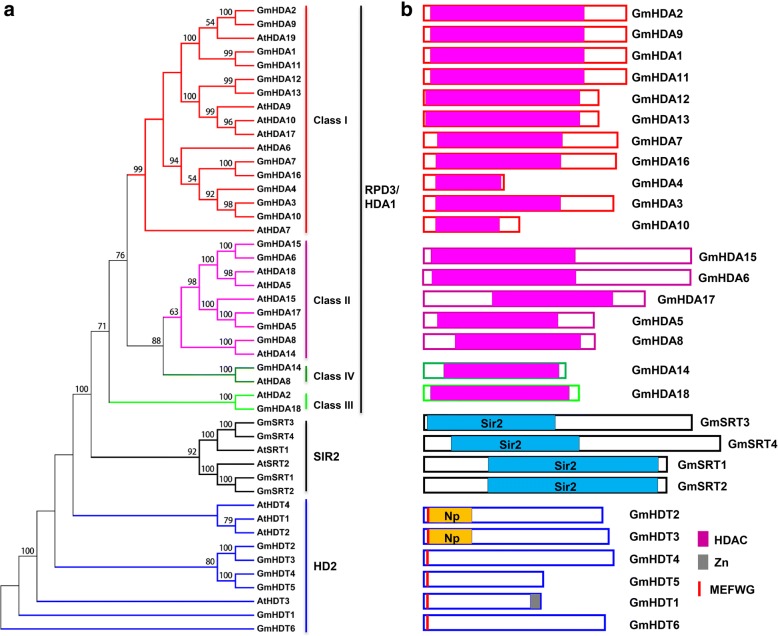
Phylogenetic tree and domain architecture of HDACs in soybean. a Phylogenetic tree of HDAC proteins in soybean and Arabidopsis. The phylogenetic tree was generated using the MEGA 5.0 software and the Maximum Parsimony method with the following parameters: bootstrap analysis of 1000 replicates and partial deletion. The numbers at the nodes indicate the bootstrap values. b The schematic diagrams show the domain organization of these proteins according to analysis by NCBI Batch-CD, SMART and PFAM searches. Different domains are indicated by the use of different colors. The proteins belonging to each family are grouped together

