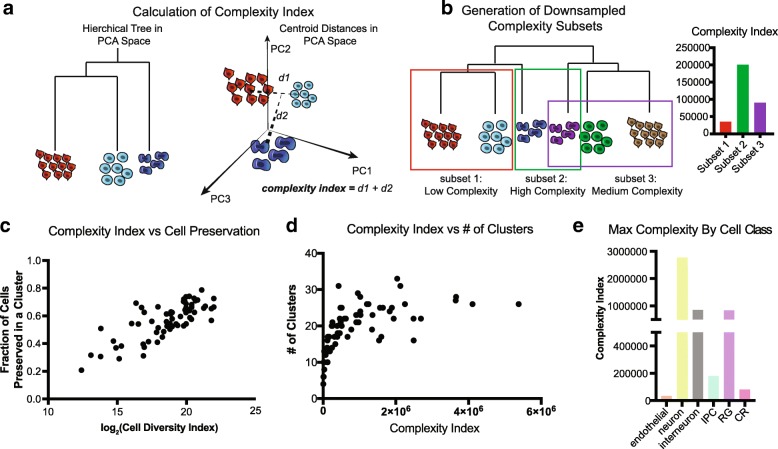
Fig. 2.
Downsampling of cell complexity preserves major cell type distinctions. a Cell complexity is calculated in the PCA space of the largest reference cell set analyzed. A hierarchical tree of clusters is calculated for each subset in the PCA space, and the total distance between the branches defines the cell complexity (see also the “Methods” section). b Cell complexity downsampling was performed by selecting branches of a larger tree with varied cell numbers and distances between groups. c Plot of complexity versus cell preservation. Each dot represents a point from 9 original subsets and a total of 56 datasets are analyzed. Log2 (cell diversity index) is used to easily interpret the dots at lower cell diversity numbers. d Number of clusters derived from subset analyses as a function of cell complexity. The graph begins to plateau at a cell complexity of ~ 100,000, suggesting there is a maximal number of clusters that can be derived from a sample even as cell number and complexity increases. e Complexity calculated by cell class annotations show neurons are the most complex of the cell types retrieved

