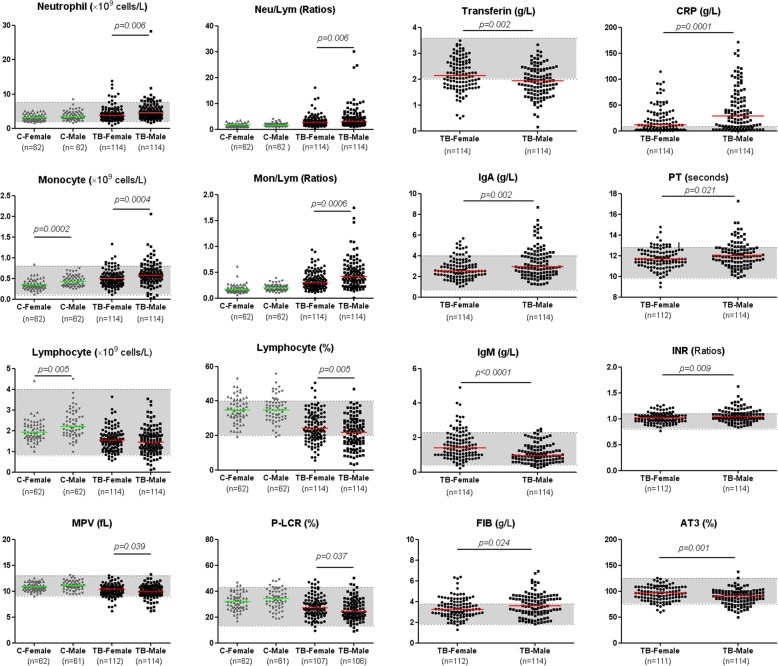
Fig. 1.
The indices with remarkable deviation from normal ranges and with significant differences between male and female TB patients. Horizontal lines represent median values. Grey areas represent the normal ranges of the indices. The differences between groups were analysed by Mann-Whitney U tests. MPV mean platelet volume, P-LCR platelet-large cell ratio, IgA immunoglobulin A, IgM immunoglobulin M, FIB fibrinogen, CRP C-reactive protein, PT prothrombin time, INR international normalized ratio, AT3 antithrombin III, Mon/Lym monocyte to lymphocyte ratio

