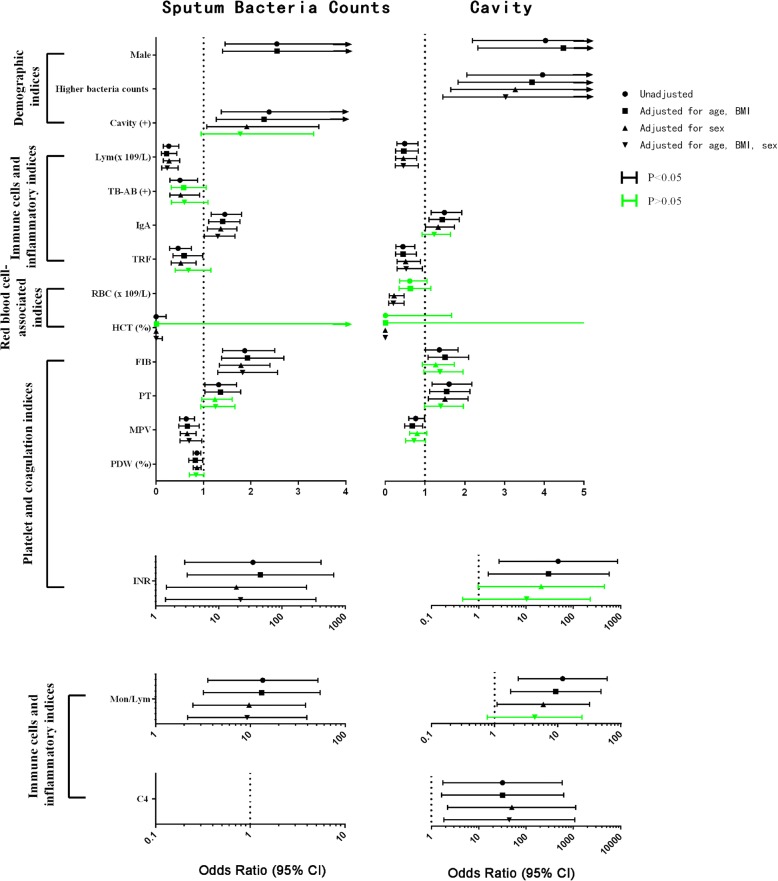
Fig. 2.
Forest plot of the indices associated with sputum bacteria counts (left) and cavity (right) among 48 indices in 228 TB patients. The dots show the unadjusted odds ratios of the association of the indices with sputum bacteria counts or cavity. Small squares indicate ORs after being adjusted with age and BMI; small triangles indicate ORs after being adjusted with sex; inverted small triangles indicate ORs after being adjusted with age, BMI and sex. Lines represent the values of the 95% CI. Black lines depict P < 0.05. Green lines depict P > 0.05 after adjustment

