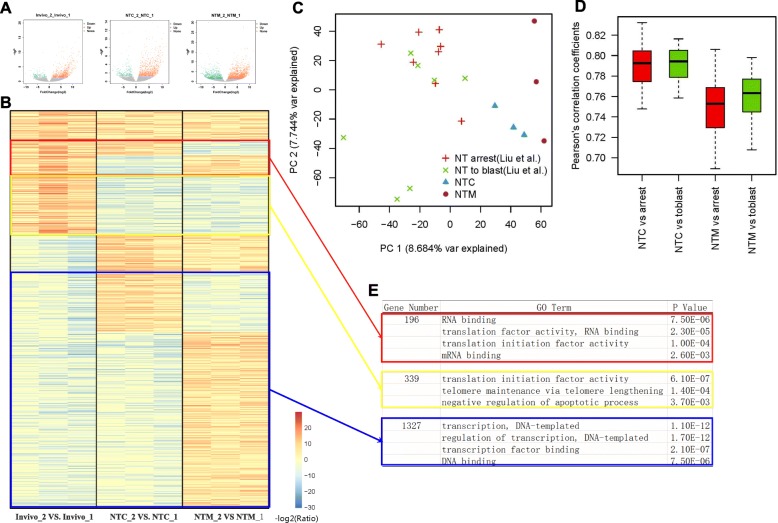
Fig. 3.
Analyses of differentially expressed genes in 1–2 cell stage embryos. a Volcano plot of 1–2 cell stage embryos. Green dots indicate down-regulated genes in the 2-cell stage compared with the 1-cell stage, red dots indicates up-regulated genes in the 2-cell stage compared with the 1-cell stage, and gray dots indicates genes that did not display a difference in transcription between the 2-cell and 1-cell stages. Every plots' Ensembl genes ID were listed in Additional file 7: Table S2. b Heatmap of all up-regulated genes (red dots) and down-regulated genes (green dots) shown in (a). Blue indicates lower expression and red indicates higher expression. Three clustered genes were selected with square. Clustered genes in the red square were expressed at higher levels in the in vivo group but displayed higher expression in only one of the NT groups. Clusters displaying similar changes are depicted by the yellow square and blue square. c PCA analysis of our data compared to GSE70608 in 2-cell NT embryos. Red crisscross (NT arrest): 2-cell embryos are developmentally arrested in the 2-cell stage (GSE70608). Green multiplication sign (NT to blast): 2-cell embryos develop to the blastula stage (GSE70608). Blue triangle: Our 2-cell NTC embryos. Purple circle: Our 2-cell NTM embryos. d Correlation analysis of our data compared to GSE70608 in 2-cell NT embryos. e GO analyses of clustered genes selected as described in (b)

