Fig. 2.

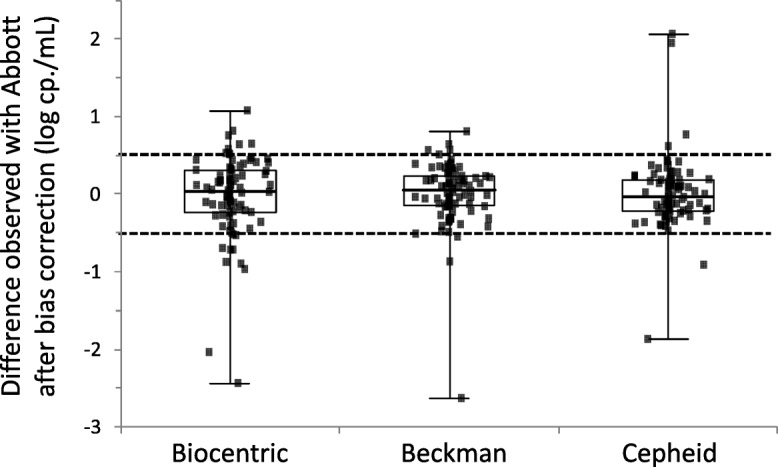
Distribution of the difference of quantification with each technique compared to Abbott values and after adjustment for each technique’s bias. Values above or below 0.5 log cp./mL are considered discordant

Distribution of the difference of quantification with each technique compared to Abbott values and after adjustment for each technique’s bias. Values above or below 0.5 log cp./mL are considered discordant