Fig. 1.

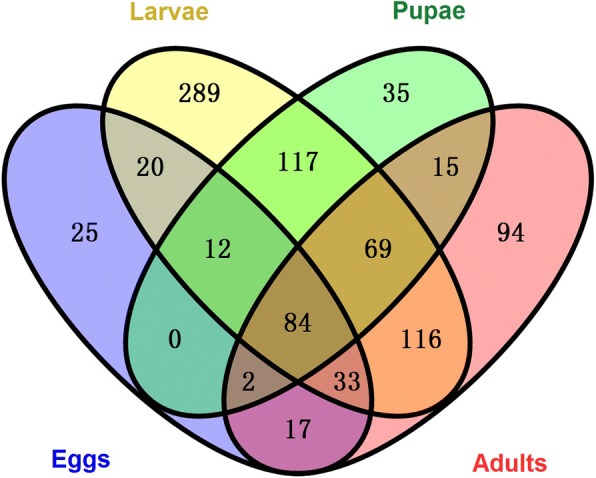
Venn diagram of OTU distribution across C. megacephala life stages. Numbers within compartments indicate OTU counts of according to mathematical sets

Venn diagram of OTU distribution across C. megacephala life stages. Numbers within compartments indicate OTU counts of according to mathematical sets