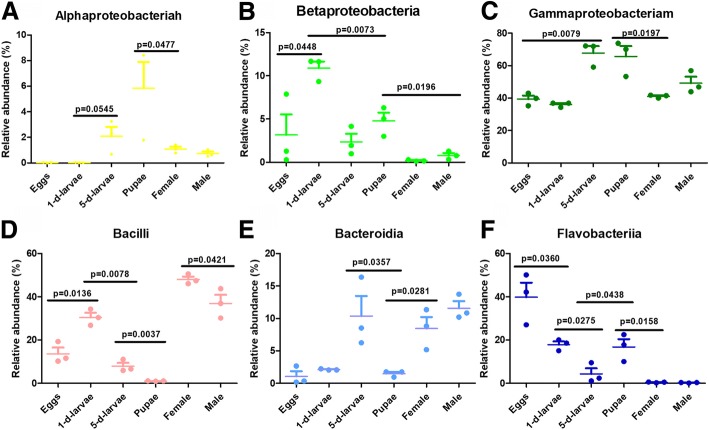
Fig. 4.
The taxonomic composition distribution in samples of Class-level. a: Alphaproteobacteria; b: Betaproteobacteria; c: Gammaproteobacteria; d: Bacilli; e: Bacteroidia; f: Flavobacteriia. The average ratio of each bacteria class in samples across life stages is directly displayed. Y-axis indicated the relative abundance of microbial communities between samples. Points showed three individual values, longer bars in each column indicated mean values while shorter bars indicate SE value. Metastats (http://metastats.cbcb.umd.edu/) and R(v3.1.1) were used to determine which taxonomic groups were significantly different between groups of samples with the obtained p-value by a Benjamini-Hochberg false discovery rate correction (function ‘p.adjust’ in the stats package of R(v3.1.1)

